

The Feldman Protocol_: Foundational Overview - Glossary of Terms
This is a living glossary designed to help you navigate the articles and stay current as new content is posted.


This glossary covers the full range of terms denoted in TFP_: from fundamental lipoprotein structure to complex parts of Dave’s research.
This is a living reference. We will try to link back to this post in newsletters so if you are new or unfamiliar with some terminology, this may help bolster your learning. We will also attempt to update each term with references in case you want a deeper dive on your deep dive.
Terms are organized by topic, not alphabetically. We hope you enjoy!
1. Core Lipoprotein Biology
Structure & Particles
Lipoprotein
Typically, a spherical particle that transports lipids (fat-soluble) through the aqueous bloodstream (water-based). Each particle has a hydrophobic core of cholesteryl esters and triglycerides, wrapped in a phospholipid monolayer covered with proteins called apolipoproteins. Think of it as a purpose-built fat-soluble cargo pod for a water-based delivery network.
Cholesteryl Ester (CE)
The storage form of cholesterol. Free cholesterol is esterified (a fatty acid is attached) by the enzyme LCAT in plasma or by ACAT inside cells, making it hydrophobic and suitable for packing into the lipoprotein core. The majority of cholesterol in LDL and HDL is in this esterified form.
Triglyceride (TG)
A glycerol molecule with three fatty acid chains attached. The primary form of dietary and stored fat. In the circulation, triglycerides are packaged into TG-rich lipoproteins — chylomicrons (from food) and VLDL (from the liver) — and delivered to tissues via LPL-mediated hydrolysis. Elevated TG can be a sign of insulin resistance.
Check out one of Dave’s older articles from cholesterolcode.com: The article proposes a “triglyceride carryover” effect, where elevated triglycerides in the morning may be from incomplete fasting related to the prior meal rather than true metabolic dysfunction. It shows that triglycerides consistently normalize after ~12+ hours of fasting, suggesting shorter fasts can result in a false positive for hypertriglyceridemia and potentially lead to misinterpretation of lipid results.
Phospholipids
Amphipathic molecules (one water-loving head, two fat-loving tails) that form the outer shell of every lipoprotein particle. This structural role makes them essential to lipoprotein integrity. Phosphatidylcholine is the most abundant type. Phospholipids are also substrates for several key enzymes including LCAT and Lp-PLA2.
Free (Unesterified) Cholesterol
Cholesterol in its unmodified form, present on lipoprotein surfaces and in cell membranes. Unlike cholesteryl esters, free cholesterol is not stored in lipoprotein cores — it sits in the surface layer. Its proportion relative to esterified cholesterol affects membrane fluidity and lipoprotein function.
Apolipoproteins
Proteins embedded in or associated with lipoprotein surfaces. They perform two essential functions: structural (holding the particle together) and functional (serving as enzyme cofactors, receptor ligands, and metabolic signals).
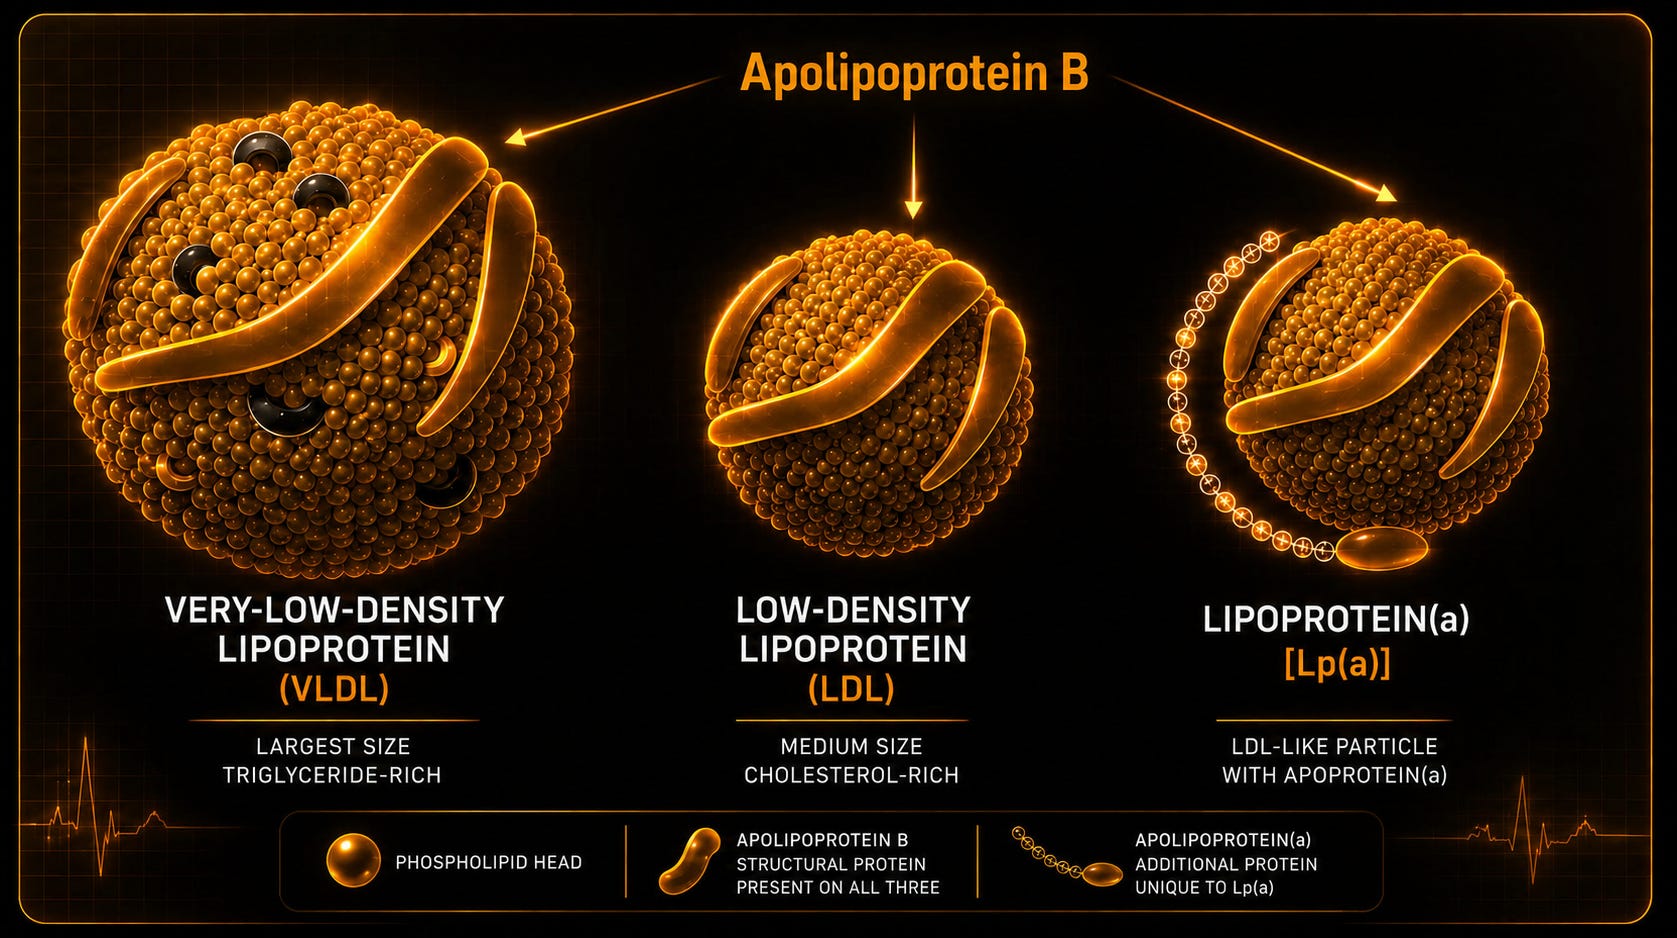
The major apolipoproteins:
ApoB-100 — Structural protein of all liver-derived lipoproteins (VLDL, IDL, LDL). One ApoB-100 per particle — the direct measure of “particle number”.
ApoB-48 — Intestinal isoform of ApoB. Structural protein of chylomicrons. Truncated version lacking the LDL receptor-binding domain.
ApoA-I — Major structural protein of HDL. Activates LCAT and drives ABCA1-mediated cholesterol efflux from macrophages. Primary functional protein of reverse cholesterol transport.
ApoE — Ligand for LDL receptor and LRP1-mediated clearance of remnant particles. Three isoforms (E2, E3, E4) with dramatically different metabolic and neurological implications.
ApoC-II — Essential activating cofactor for lipoprotein lipase (LPL). Without ApoC-II, LPL cannot efficiently hydrolyze TG in chylomicrons and VLDL.
ApoC-III — Inhibitor of LPL and of hepatic uptake of remnant particles. High ApoC-III is associated with elevated TG and increased remnant cholesterol.
One of the most important conceptual shifts in modern lipidology: apolipoproteins are not passive structural scaffolding…they help the lipoproteins go where they need to go the moment they enter circulation.
HDL-C (HDL Cholesterol)
The cholesterol content of high-density lipoprotein particles. Measured as part of the standard lipid panel. Sometimes called ‘good cholesterol’ because higher levels of HDL-C are inversely associated with cardiovascular risk.
LDL-C (LDL Cholesterol)
The cholesterol content of low-density lipoprotein particles. The most widely used lipid treatment target in clinical guidelines worldwide. Usually calculated via the Friedewald equation (TC − HDL-C − TG/5) which may grossly underestimate LDL-C when TG are higher.
LDL-C measures the cargo, not the number of ships. In certain situations, LDL-C by itself may not give the best indication of how many LDL particles there are. For example, someone with a lower LDL-C may have a higher LDL particle count than anticipated if those LDL particles are smaller, more lipid poor, particles.
NEFA (Non-Esterified Fatty Acids / Free Fatty Acids)
Fatty acids circulating in the bloodstream bound to albumin, not packaged in lipoproteins. Released from adipose tissue during lipolysis (fasting, exercise, stress) or from TG hydrolysis by LPL. The primary fuel substrate during fasting and sustained aerobic exercise.
Elevated fasting NEFA in the context of elevated insulin is a marker of insulin resistance — adipose tissue lipolysis is normally suppressed by insulin. High NEFA may also drive hepatic VLDL production and contribute to ectopic fat deposition in this context.
Major Lipoprotein Classes
Chylomicrons
The largest lipoprotein (~75–1200 nm), assembled in intestinal enterocytes (intestinal lining cells) from dietary fat and secreted into the lymph before reaching the bloodstream. Contain ApoB-48, ApoC-II, ApoC-III, and ApoE. Deliver dietary TG to peripheral tissues via LPL-mediated hydrolysis. What remains after TG is stripped is the chylomicron remnant.
Chylomicrons themselves are typically considered too large to enter the arterial wall while their remnants (partially digested byproducts) are not.
VLDL (Very Low-Density Lipoprotein)
The liver’s endogenous TG-transport particle. Contains ApoB-100. Secreted in large quantities in states of insulin resistance, high carbohydrate intake, or excess free fatty acid flux to the liver. Progressive LPL-mediated lipolysis converts VLDL → IDL → LDL.
Excess VLDL secretion paired with poor VLDL turnover is the upstream driver of the most common atherogenic dyslipidemia pattern: high TG, low HDL-C, and small dense LDL.
IDL (Intermediate-Density Lipoprotein)
The transitional particle formed when VLDL is partially lipolyzed. Carries ApoB-100 and ApoE. Either cleared by the LDL receptor (via ApoE binding) or further processed by hepatic lipase into LDL. Elevated levels are typically considered a risk for heart disease, but IDL isn’t measured on standard lipid panels. Levels are measured indirectly via non-HDL-C, ApoB, and remnant cholesterol calculations.
LDL (Low-Density Lipoprotein)
The end product of VLDL lipolysis. Cholesterol-enriched, ApoB-100-bearing. Typically considered by many lipidologists to be the particle most strongly associated with atherosclerosis. Some research indicates it enters the subendothelial space via transcytosis at a rate proportional to circulating particle concentration.
HDL (High-Density Lipoprotein)
The smallest and densest lipoprotein. Accepts cholesterol from peripheral tissues and macrophages via ABCA1 and ABCG1 transporters, matures via LCAT, and delivers cholesteryl esters to the liver via SR-B1. This cycle — from tissue to particle to liver — is reverse cholesterol transport (RCT).
HDL is often considered to be anti-atherogenic primarily through cholesterol efflux and RCT.
Lp(a) (Lipoprotein(a))
An LDL-like particle with an additional protein — Apo(a) — covalently bonded to ApoB-100 via a disulfide bridge. Apo(a) has structural homology to plasminogen, and as such many in lipidology consider Lp(a) to have both atherogenic properties (subintimal retention, foam cell induction, vascular calcification) and prothrombotic properties (impaired fibrinolysis). Some research also indicates Lp(a) may also play a role in wound healing, and in the immune system. Lp(a) level is typically assumed to be ~90% genetically determined by the LPA gene. However, other influences on Lp(a) level have also been observed. For example, Lp(a) is also an Acute Phase Reactant (APR) and thus may be influenced by inflammatory signaling, and changes from diet-related factors have also been observed (Vitamin C, carnitine, low carbohydrate diets).
Particle Subtypes & Patterns
Small Dense LDL (sdLDL) / Pattern B
A subpopulation of LDL particles smaller than ~25.5 nm and denser than the predominant large buoyant LDL. Associated with lower LDL receptor affinity (longer plasma residence time), and more susceptibility to oxidative modification. Many lipidologists consider sdLDL particles to be more atherogenic for these reasons, and because some evidence suggests they may be more likely to be retained by the arterial wall. Pattern B denotes predominance of sdLDL.
Pattern B is has been strongly associated with insulin resistance, elevated TG, and low HDL-C. It starts to emerge more frequently when TGs exceed 95 mg/dl. Some lipidologists use a LDL-C/ApoB ratio as a quick screen: a low ratio (<1.2) is associated with small, cholesterol-poor particles even when LDL-C is low.
Large Buoyant LDL / Pattern A
The larger, less dense LDL subclass — diameter above ~25.5 nm. Associated with better LDL receptor affinity and lower oxidizability compared to sdLDL. Pattern A denotes predominance of large buoyant particles.
HDL2 vs HDL3
HDL exists as a spectrum of subclasses. HDL2 is larger and more buoyant, enriched in cholesteryl esters, and reflects more mature HDL. HDL3 is smaller and denser, reflecting nascent or remodeled HDL. Hepatic lipase converts HDL2 → HDL3; LCAT activity drives the reverse.
Remnant Particles
Chylomicron remnants and VLDL remnants (including IDL) formed after LPL-mediated TG hydrolysis. Enriched in cholesteryl esters, ApoE, and ApoC-III.
Functional Lipid Fractions & Metrics
Remnant Cholesterol (RC)
Cholesterol carried in VLDL, IDL, and chylomicron remnants. Calculated as TC − HDL-C − LDL-C. A direct measure of the cholesterol burden from TG-rich lipoprotein remnants. Not a separate lab test on standard panels — it is derived from existing values.
LDL-TG / eLDL-TG (LDL Triglyceride Content)
The triglyceride content within LDL particles. LDL normally carries very little TG, but in insulin-resistant states with high CETP activity, TG is exchanged into LDL in return for cholesteryl esters — producing TG-enriched, cholesteryl ester-depleted LDL. eLDL-TG is an estimated version using surrogate calculations. It has been proposed that LDL-TG may be an early sign of one’s fat cells becoming overstuffed and insulin resistant (sometimes also called a Personal Fat Threshold).

Non-HDL-C
Total cholesterol minus HDL-C. Captures cholesterol in all apoB-containing lipoprotein classes. Requires no fasting and no extra calculations beyond standard panel results.ApoB Concentration
The direct plasma concentration of apolipoprotein B — one molecule per particle. Measured by immunoassay. Captures LDL, VLDL, IDL, Lp(a), and chylomicrons in a single number. In mainstream lipidology, considered the most accurate single measure of cardiovascular “particle burden”.
ApoA-I Concentration
The plasma concentration of apolipoprotein A-I, measured by immunoassay. The primary structural and functional protein of HDL. Often considered to be one of the more accurate proxies for HDL particle number and potentially, by extension, reverse cholesterol transport capacity.
The ApoB/ApoA-I ratio captures both possible “atherogenic” burden (ApoB) and antiatherogenic capacity (ApoA-I) in a single number and is among the lipid ratios most strongly associated with CV risk in large population studies.
2. Lipid Transport, Enzymes & Regulatory Proteins
Lipid Metabolism Enzymes
LPL (Lipoprotein Lipase)
Anchored to capillary endothelium in muscle, adipose, and cardiac tissue. Hydrolyzes TG in circulating chylomicrons and VLDL, releasing fatty acids for local uptake and energy use. Activated by ApoC-II and ApoA-V; inhibited by ApoC-III and ANGPTL3/4/8.
LPL is the gatekeeper of plasma TG clearance.
Hepatic Lipase (HL)
A liver-expressed lipase that remodels IDL into LDL (by removing residual TG) and converts larger HDL2 into smaller HDL3 (by hydrolyzing HDL phospholipids and TG). High hepatic lipase activity is associated with small dense LDL and smaller HDL particles.
Hepatic lipase activity is increased in insulin-resistant states — one mechanism by which metabolic syndrome drives Pattern B dyslipidemia and lowers HDL2.
Endothelial Lipase (EL)
A lipase expressed on vascular endothelium with preferential activity for phospholipids in HDL. Hydrolyzes HDL phospholipids, reducing HDL particle size and accelerating HDL catabolism. Upregulated by inflammatory cytokines.
Endothelial lipase is a key link between systemic inflammation and low HDL-C — it partly explains why inflammatory conditions (sepsis, rheumatoid arthritis, acute illness) cause rapid HDL-C drops independent of other lipid changes.
CETP (Cholesteryl Ester Transfer Protein)
Shuttles cholesteryl esters from HDL to VLDL/LDL in exchange for triglycerides. Bridges the HDL and atherogenic lipoprotein metabolic pools. Elevated CETP activity simultaneously lowers HDL-C and enriches VLDL with cholesteryl esters.
LCAT (Lecithin-Cholesterol Acyltransferase)
Esterifies free cholesterol on HDL, converting nascent discoidal HDL into mature spherical HDL. Activated by ApoA-I. A critical step in HDL maturation and reverse cholesterol transport efficiency.
ACAT2 (Acyl-CoA:Cholesterol Acyltransferase 2)
Expressed in intestinal enterocytes and hepatocytes. Esterifies free cholesterol for packaging into chylomicrons (intestine) and VLDL (liver). Enables dietary and newly synthesized cholesterol to be incorporated into lipoproteins for transport.
HMG-CoA Reductase
The rate-limiting enzyme in the mevalonate pathway — converts HMG-CoA to mevalonate, the precursor to cholesterol and isoprenoids. Expressed primarily in the liver. Upregulated by SREBP-2 when intracellular cholesterol falls. The direct molecular target of statins.
Lathosterol and desmosterol, measurable on sterol panels, reflect HMG-CoA reductase activity. A ‘hypersynthesizer’ with elevated lathosterol has upregulated flux through this pathway.
PLTP (Phospholipid Transfer Protein)
Transfers phospholipids between lipoprotein particles — particularly from TG-rich lipoproteins to HDL during lipolysis. PLTP activity modulates HDL particle size and composition and influences the overall lipoprotein remodeling landscape.
PLTP is elevated in insulin-resistant states and may contribute to HDL dysfunction and the production of small, dysfunctional HDL particles independent of CETP activity.
Apolipoproteins (Regulatory & Structural)
Note: ApoB-100, ApoB-48, ApoA-I, ApoE are covered in depth in Section 1. The entries below focus on the regulatory apolipoproteins and Apo(a).
ApoC-II
The obligate activating cofactor for LPL. Without ApoC-II on the chylomicron or VLDL surface, LPL cannot efficiently hydrolyze the particle’s TG core. Deficiency causes a rare but severe hypertriglyceridemia with pancreatitis risk.
ApoC-II must be transferred from HDL to chylomicrons and VLDL for LPL activation to occur — a neat example of how HDL acts not just as a cholesterol carrier but as a TG metabolism coordinator.
ApoC-III
Considered by some lipidologists to be one of the most clinically important regulatory apolipoproteins. Inhibits LPL directly, inhibits hepatic uptake of TG-rich lipoprotein remnants, and may promote hepatic VLDL secretion. Elevated ApoC-III is consistently associated with elevated TG and increased remnant particle burden.
ApoC-III on LDL particles may also be an independent predictor of CV risk.
Apo(a)
The defining structural protein of Lp(a). Covalently bonded to ApoB-100. Contains multiple kringle repeat domains with strong structural homology to plasminogen’s kringle domains. The number of kringle IV type 2 repeats (encoded by the LPA gene) inversely determines Lp(a) particle size and is typically considered to be the primary determinant of plasma Lp(a) concentration.
Shorter Apo(a) isoforms (fewer kringle repeats) are produced and secreted more efficiently, leading to higher circulating Lp(a) levels.
Receptors & Transporters
LDL Receptor (LDLr)
The primary hepatic receptor for LDL and remnant particle clearance. Binds ApoB-100 (on LDL) and ApoE (on remnants and IDL), internalizes them via endocytosis, releases cargo in the lysosome, and recycles to the cell surface. LDL receptors can also be expressed by other nucleated cells, like endothelial cells and macrophages. Expression is transcriptionally regulated by SREBP-2 and post-translationally by PCSK9.
The most common cause of FH an LDLR receptor defect.
LRP (LDL Receptor-Related Protein / LRP1)
A large multi-ligand endocytic receptor on hepatocytes and macrophages. Binds ApoE-containing remnant particles (chylomicron remnants, IDL) for clearance. Acts as a backup to the LDL receptor for remnant clearance.
LRP1 is particularly important in the postprandial state when large numbers of chylomicron remnants must be cleared from circulation. Its activity may help explain why remnant cholesterol clearance varies considerably between individuals.
SR-B1 (Scavenger Receptor Class B Type 1)
The hepatic receptor for selective cholesteryl ester uptake from HDL — without internalizing the whole particle. HDL docks, offloads its CE cargo, and returns to circulation lipid-depleted. The terminal step of reverse cholesterol transport.
SR-B1 deficiency in mice produces high HDL-C and simultaneously increased atherosclerosis — possibly because despite the higher HDL-C, the HDL particles are not able to function normally.
LOX-1 (Lectin-Like Oxidized LDL Receptor-1)
A scavenger receptor expressed on endothelial cells and macrophages that mediates uptake of oxidized LDL. Unlike the LDL receptor, LOX-1 uptake is not feedback-regulated by cellular cholesterol, allowing uncontrolled intracellular cholesterol accumulation.
LOX-1 expression is upregulated by inflammatory cytokines, angiotensin II, and shear stress — potentially explaining why hypertension and inflammation may accelerate foam cell formation and atherosclerosis independently of plasma LDL-C levels.
NPC1L1 (Niemann-Pick C1-Like 1)
Expressed in intestinal enterocyte brush borders and liver canaliculi. Mediates cholesterol absorption from the intestinal lumen into enterocytes. The molecular target of ezetimibe.
Hyperabsorbers — identifiable by elevated sitosterol and campesterol on a sterol panel — have constitutively high NPC1L1 activity.
ABCG5 / ABCG8
A heterodimeric transporter pair in intestinal enterocytes and hepatocytes. Pumps plant sterols (sitosterol, campesterol) and excess cholesterol back into the intestinal lumen or bile, preventing systemic accumulation.
Loss-of-function mutations cause sitosterolemia — dramatically elevated plant sterols, xanthomas, and premature atherosclerosis. Often misdiagnosed as FH because plant sterols cross-react in some cholesterol assays.
ABCA1 (ATP-Binding Cassette Transporter A1)
Effluxes cholesterol and phospholipids from cell membranes to lipid-free ApoA-I, forming nascent discoidal HDL. The first obligate step in reverse cholesterol transport. Loss-of-function causes Tangier disease (near-absent HDL, cholesterol accumulation in tissues).
Macrophage ABCA1-mediated cholesterol efflux capacity — a functional measure of how much cholesterol can be exported per unit time — has shown stronger associations with CV risk than HDL-C concentration in some prospective studies.
ABCG1 (ATP-Binding Cassette Transporter G1)
Works downstream of ABCA1. Effluxes cholesterol from cells to mature, lipidated HDL particles. ABCA1 and ABCG1 operate in tandem to complete macrophage cholesterol efflux.
While ABCA1 handles the first step (nascent HDL formation), ABCG1 handles the second (cholesterol loading into mature HDL). Both are transcriptionally regulated by LXR — a key nuclear receptor activated by cholesterol excess.
Regulatory Pathways & Proteins
PCSK9
A hepatocyte-secreted serine protease that binds LDL receptors after LDL internalization and routes the LDLr-PCSK9 complex to lysosomal degradation rather than receptor recycling. Net result: fewer LDL receptors on the hepatocyte surface, less LDL clearance, higher circulating LDL-C.
PCSK9 gain-of-function mutations are a cause of FH.
SREBP-2 (Sterol Regulatory Element-Binding Protein 2)
A transcription factor that acts as the master regulator of cholesterol synthesis and uptake. When intracellular cholesterol falls, SREBP-2 is processed and translocates to the nucleus, upregulating HMG-CoA reductase (synthesis) and LDL receptor (uptake). This is the primary mechanism by which statins lower LDL-C.
SREBP-1c (Sterol Regulatory Element-Binding Protein 1c)
A transcription factor that is the master regulator of fatty acid and triglyceride synthesis. Activated by insulin and LXR. Drives expression of genes for de novo lipogenesis (DNL) — the conversion of carbohydrates to fat in the liver.
SREBP-1c is a key mechanistic link between high carbohydrate intake, hyperinsulinemia, hepatic fat synthesis, and VLDL overproduction. This pathway is central to understanding how refined carbohydrates may drive hypertriglyceridemia. Necrotic core growth is driven by both lipid supply (LDL, remnants) and impaired efferocytosis. Reducing circulating lipids and reducing inflammation are both considered to be mechanistically relevant to plaque stabilization.
FoxO1 (Forkhead Box O1)
A transcription factor that regulates hepatic gluconeogenesis and is suppressed by insulin signaling. Also contributes to regulation of ApoC-III and VLDL production. In insulin resistance, FoxO1 remains active when it should be suppressed.
FoxO1 provides a mechanistic link between insulin resistance and elevated ApoC-III: impaired insulin suppression of FoxO1 allows continued ApoC-III expression, which inhibits LPL and raises plasma TG.
FXR (Farnesoid X Receptor)
A nuclear receptor activated by bile acids. Acts as the body’s primary bile acid sensor. When activated, FXR suppresses bile acid synthesis, upregulates bile acid transporters, and reduces hepatic TG production (via suppression of SREBP-1c).
FGF19 / FGF21
FGF19 is an intestinal hormone secreted in response to FXR activation by bile acids. It acts on the liver to suppress further bile acid synthesis and inhibits hepatic glucose and lipid production. FGF21 is a liver-derived metabolic hormone activated by PPARα and metabolic stress. It regulates fatty acid oxidation, glucose uptake, and energy expenditure.
ANGPTL3 / 4 / 8 (Angiopoietin-Like Proteins)
A family of circulating proteins that inhibit LPL activity in a coordinated, tissue-specific manner, regulating where fatty acids from TG hydrolysis are delivered depending on fed/fasted state. ANGPTL3 also inhibits endothelial lipase. ANGPTL3 loss-of-function produces a unique phenotype: simultaneously low LDL-C, low TG, and low HDL-C — with markedly reduced ASCVD.
LXR (Liver X Receptor)
A nuclear receptor activated by oxysterols (cholesterol metabolites), functioning as an intracellular cholesterol sensor. When activated, LXR upregulates ABCA1, ABCG1, ABCG5/G8, and SREBP-1c. Net effect: promotes cholesterol efflux and export while also increasing fatty acid synthesis.
PPARα (Peroxisome Proliferator-Activated Receptor Alpha)
A nuclear receptor expressed primarily in liver and muscle. Activated by fatty acids and fibrates. Upregulates LPL expression, downregulates ApoC-III, increases fatty acid oxidation, and reduces hepatic VLDL production.
PPARα is also activated by fasting and ketogenic diets — increased fatty acid availability during carbohydrate restriction upregulates PPARα target genes, increasing fatty acid oxidation and reducing TG. This is part of the metabolic shift underlying low-carb-induced TG reduction.
PPARγ (Peroxisome Proliferator-Activated Receptor Gamma)
A nuclear receptor expressed primarily in adipose tissue. Master regulator of adipocyte differentiation and lipid storage. Improves insulin sensitivity by redistributing fat from ectopic sites (liver, muscle) into subcutaneous adipose.
Bile Acids
Sterol-derived molecules synthesized in the liver from cholesterol, secreted into bile, and used to emulsify dietary fats in the intestine. Reabsorbed in the ileum and recycled via the portal circulation (enterohepatic circulation). Also function as signaling molecules via FXR and TGR5 receptors.
Major Transport Pathways
Exogenous Lipid Pathway
Dietary fat packaged into chylomicrons in intestinal enterocytes → secreted into lymph → enters bloodstream → TG hydrolyzed by LPL in peripheral tissues → chylomicron remnants taken up by liver via LDL receptor and LRP1.
Endogenous Lipid Pathway
Liver secretes VLDL loaded with TG and ApoB-100 → peripheral LPL converts VLDL → IDL → LDL → LDL taken up by LDL receptor-expressing cells (liver, adrenals, gonads, etc.).
Insulin resistance increases VLDL secretion and impairs LPL activity simultaneously — a double hit that explains why metabolic syndrome so reliably produces elevated TG and the full atherogenic dyslipidemia triad.
Reverse Cholesterol Transport (RCT)
The pathway by which cholesterol is transported from peripheral tissues and macrophages back to the liver for excretion. Steps: (1) ABCA1 effluxes cholesterol to lipid-free ApoA-I → forms nascent HDL; (2) LCAT esterifies free cholesterol → matures HDL; (3) CETP may exchange CE for TG with LDL/VLDL; (4) SR-B1 on hepatocytes accepts CE from HDL; (5) Liver excretes cholesterol as bile acids or free cholesterol.
RCT efficiency — not just HDL-C — is the current mechanistic focus of HDL research. Cholesterol efflux capacity has shown associations with CV events independently of HDL-C in multiple prospective studies.
3. Atherogenesis & Vascular Biology
Plaque Biology & Imaging
Low Attenuation Plaque (LAP)
On coronary CT angiography (CCTA), plaque with CT attenuation below 30 Hounsfield units. Corresponds histologically to lipid-rich or necrotic core content. A high-risk plaque feature predictive of acute coronary syndrome risk beyond stenosis severity.
TAV / PAV (Total Atheroma Volume / Percent Atheroma Volume)
IVUS-derived measures of plaque burden. TAV is the absolute volume of plaque across a standardized coronary segment. PAV normalizes TAV to total vessel volume, enabling comparison across patients.
NCPV (Non-Calcified Plaque Volume)
The CCTA-derived volume of non-calcified (soft) plaque in the coronary arteries. Includes lipid-rich, fibrous, and mixed plaque. Regarded as more dynamic and more susceptible to rupture than calcified plaque.
Thin-Cap Fibroatheroma (TCFA)
A high-risk (vulnerable) plaque morphology: large lipid-rich necrotic core with an overlying fibrous cap measuring less than 65 µm. The thin cap is mechanically susceptible to rupture under hemodynamic stress. TCFA rupture and subsequent thrombosis is the most common mechanism of acute MI.
TCFAs can now be identified non-invasively on CCTA via high-risk plaque features: low attenuation, positive remodeling, napkin-ring sign, and spotty calcification — predicting ACS risk beyond stenosis severity alone.
Necrotic Core
The lipid-rich, acellular region inside an advanced plaque formed by accumulated apoptotic foam cells and extracellular lipid. Grows when efferocytosis (clearance of dead cells) is overwhelmed. A large necrotic core is the defining feature of a high-risk vulnerable plaque.
Necrotic core growth is driven by both lipid supply (LDL, remnants) and impaired efferocytosis. Reducing circulating lipids and reducing inflammation are both mechanistically relevant to plaque stabilization.
Fibrous Cap
The layer of smooth muscle cells, macrophages, and collagen that overlies the necrotic core. Thickness determines mechanical stability. Maintained by collagen synthesis (SMCs) and degraded by matrix metalloproteinases (MMPs) produced by activated macrophages.
Spotty Calcification
Small microcalcifications within lipid-rich plaque. On CCTA, identified as small, punctate calcium deposits within non-calcified plaque regions. Associated with local inflammation and macrophage activity rather than stable organized calcium.
Spotty calcification is considered a high-risk plaque feature that may seem counterintuitive given that high CAC scores generally indicate stable plaque. The distinction is that microcalcification indicates active, ongoing, inflammation, which isn’t inherently implied by macrocalcification.
Positive / Negative Remodeling
Positive remodeling: outward expansion of the vessel wall to accommodate growing plaque (the Glagov phenomenon). The arterial lumen is preserved despite significant plaque accumulation, causing standard angiography to miss the burden. Negative remodeling: inward vessel constriction, leading to lumen reduction out of proportion to plaque volume.
Positive remodeling is considered a high-risk CCTA feature associated with vulnerable, lipid-rich plaque. It may explain why many patients have their first acute MI without any prior warning on functional stress tests — the lumen looks fine until the plaque ruptures.
Cellular Mechanisms
Endothelial Dysfunction
Typically thought of as the earliest and most reversible stage of atherogenesis. Characterized by reduced nitric oxide (NO) production by eNOS, increased endothelial permeability, upregulation of adhesion molecules (ICAM-1, VCAM-1, E-selectin), and a pro-inflammatory, pro-thrombotic endothelial phenotype.
Endothelial dysfunction is detectable before structural plaque forms and can be measured by flow-mediated dilation (FMD) of the brachial artery.
Transcytosis
The vesicle-mediated transport of ApoB-containing lipoproteins (primarily LDL) across the endothelial cell into the subintimal space.
Monocytes → Macrophages → Foam Cells
The cellular sequence at the heart of early plaque development. (1) Circulating monocytes are recruited to the endothelium via chemokines (MCP-1/CCL2) and adhesion molecules. (2) They transmigrate into the subintimal space and differentiate into macrophages under M-CSF signaling. (3) Macrophages ingest modified LDL via unregulated scavenger receptors (SR-A, CD36, LOX-1), accumulating intracellular lipid and becoming foam cells.
Foam cell formation is not just a passive lipid-filling process — foam cells are metabolically active, secreting cytokines, proteases, and reactive oxygen species that drive plaque progression and instability.
Smooth Muscle Cells (SMC) in Atherosclerosis
Vascular smooth muscle cells (VSMCs) migrate from the media to the intima in response to PDGF and other growth signals. In the intima they proliferate and produce extracellular matrix — contributing to the fibrous cap. However, SMCs can also take up oxidized LDL via scavenger receptors and become foam cells.
SMC-derived foam cells have only recently been recognized as a significant component of advanced plaques. Single-cell RNA sequencing studies suggest SMCs contribute substantially to the foam cell pool.
T-Lymphocytes in Atherosclerosis
Activated T cells (primarily Th1 subtype) infiltrate plaques and secrete pro-inflammatory cytokines (IFN-γ, TNF-α) that amplify macrophage activation, increase MMP production (destabilizing the fibrous cap), and impair efferocytosis. Regulatory T cells (Tregs) play a counterbalancing anti-inflammatory role.
The adaptive immune system plays a meaningful role in plaque progression and vulnerability.
Oxidation, Modification & Inflammation
OxLDL (Oxidized LDL)
LDL that has undergone oxidative modification of its lipid and protein components in the subendothelial space. Recognized by scavenger receptors (LOX-1, SR-A, CD36) on macrophages, driving foam cell formation. Also activates endothelial cells and promotes inflammation.
Some lipidologists suggest that clinically meaningful oxidation of LDL occurs within the subintima, and that antioxidants in the serum would largely prevent oxidation of LDL in the bloodstream. On the other hand, serum oxidized LDL can be measured in humans, and has been induced in vivo in some animal models. In any case, antioxidant defenses (PON1, vitamin E) modulate the rate of LDL oxidation and may partly explain variation in CV risk at the same LDL-C level.
OxPL-ApoB (Oxidized Phospholipids on ApoB)
Oxidized phospholipids covalently bound to ApoB-containing lipoproteins — particularly Lp(a). Among the most potent pro-inflammatory lipid signals known. Activate endothelial cells, drive macrophage foam cell formation, stimulate osteoblast-like differentiation in valvular tissue, and promote vascular calcification.
OxPL-ApoB is strongly correlated with Lp(a) levels and evidence suggests it has independent predictive value for aortic valve stenosis and coronary events beyond standard lipid panels.
Lp-PLA2 (Lipoprotein-Associated Phospholipase A2)
An enzyme carried on LDL (and to a lesser extent HDL) that cleaves oxidized phospholipids in the subendothelial space, generating lysophosphatidylcholine and oxidized free fatty acids — both potent pro-inflammatory mediators. Used clinically as a marker of plaque inflammation.
PON1 (Paraoxonase 1)
An HDL-associated esterase/lactonase with antioxidant properties. Hydrolyzes oxidized lipids on LDL and HDL, preventing lipoprotein oxidation and reducing pro-inflammatory OxPL generation. A key component of HDL’s protective function beyond its cholesterol-carrying role.
PON1 activity is reduced in smokers, diabetics, and those with chronic inflammation — contributing to a more pro-atherogenic LDL and dysfunctional HDL phenotype that standard cholesterol measurements miss.
hsCRP (High-Sensitivity C-Reactive Protein)
An acute-phase protein produced by the liver in response to IL-6 signaling. A marker of systemic inflammation. Elevated hsCRP (>2 mg/L) is associated with higher residual CV risk independent of LDL-C. May also be elevated by recent exercise, illness, or other conditions.
IL-6 / IL-1β
Key pro-inflammatory cytokines in atherogenesis. IL-1β (produced by macrophages and the NLRP3 inflammasome) drives hepatic IL-6 production, which in turn drives CRP synthesis and acute-phase responses. Both amplify endothelial activation, promote monocyte recruitment, and destabilize plaques.
NLRP3 Inflammasome
A cytosolic multiprotein complex in macrophages activated by cholesterol crystals, oxidized lipids, and other danger signals. Upon activation, it processes pro-caspase-1 which cleaves pro-IL-1β into active IL-1β — a potent local and systemic inflammatory driver. Cholesterol crystals in plaques are a direct NLRP3 activator.
The NLRP3 inflammasome contributes to our understanding of plaques as not just lipid deposits but active inflammatory lesions.
GlycA
An NMR-derived composite marker of systemic inflammation reflecting glycan modifications across multiple acute-phase proteins simultaneously (haptoglobin, alpha-1-acid glycoprotein, transferrin, others). More stable and reproducible than hsCRP, which can spike acutely with minor illness and recent exercise.
In some individuals who adopt low carbohydrate diets, GlycA may decrease substantially if elevated— one of the metabolic improvements tracked in LMHR and ketogenic diet research that tends to be underappreciated when some discussion focuses exclusively on LDL-C changes.
4. Genetic & Causal Inference Concepts
Genetic Conditions
heFH (Heterozygous Familial Hypercholesterolemia)
The most common monogenic lipid disorder (~1 in 250 globally). Caused by LDLR mutations (~85%), ApoB-R3500Q mutations (~5–10%), or PCSK9 gain-of-function variants (~1–2%). One defective LDLR allele reduces LDL clearance by ~50%, producing LDL-C typically 190–400 mg/dL from birth. Caused by LDLR mutations (~85%), ApoB-R3500Q mutations (~5–10%), or PCSK9 gain-of-function variants (~1–2%).
hoFH (Homozygous Familial Hypercholesterolemia)
Rare (~1 in 300,000). Most commonly caused by biallelic LDLR dysfunction which produces LDL-C typically above 400–500 mg/dL, sometimes exceeding 1000 mg/dL. MI in childhood is the natural history. Planar and tendon xanthomas are hallmarks.
Familial Combined Hyperlipidemia (FCHL)
The most common familial lipid disorder (~1 in 100–200). Characterized by elevated LDL-C, elevated TG, or both — varying within and between family members. Driven by hepatic ApoB overproduction and influenced by metabolic status. Polygenic with strong environmental modifiers.
Familial Dysbetalipoproteinemia (Type III Hyperlipidemia)
Generally amplified by the ApoE2/E2 genotype (~1% of the population carries two E2 alleles, but only ~10% of them develop Type III). ApoE2 binds poorly to the LDL receptor, impairing remnant clearance. The result: dramatic accumulation of IDL and chylomicron remnants, elevated cholesterol and TG, with distinctive palmar xanthomas (xanthoma striata palmaris) and high atherosclerotic risk.
The penetrance is incomplete — most ApoE2/E2 individuals do not develop Type III without a metabolic ‘second hit’ (obesity, hypothyroidism, diabetes). Some lipidologists recommend testing ApoE genotype in anyone with mixed hyperlipidemia and both TC and TG elevated.
Familial Chylomicronemia Syndrome (FCS / LPLD)
A rare autosomal recessive disorder caused by biallelic loss-of-function mutations in LPL or its essential cofactors (ApoC-II, ApoA-V, LMF1, GPIHBP1). Results in near-complete failure of TG hydrolysis. TG routinely exceeds 880 mg/dL. Clinical hallmarks: milky plasma, eruptive xanthomas, lipemia retinalis, recurrent pancreatitis.
Tangier Disease
A rare autosomal recessive disorder caused by ABCA1 loss-of-function mutations. Without ABCA1, cells cannot efflux cholesterol to form nascent HDL. Resulting phenotype: near-absent HDL-C, orange tonsillar deposits, peripheral neuropathy, hepatosplenomegaly, and premature atherosclerosis.
Tangier disease demonstrates that ABCA1-mediated cholesterol efflux is non-redundant — other efflux pathways cannot compensate when ABCA1 is absent. It validated the mechanistic importance of ABCA1 in human lipid biology.
Sitosterolemia
Rare autosomal recessive disorder caused by ABCG5 or ABCG8 mutations. Massively elevated plasma plant sterols, tendon and tuberous xanthomas, and premature atherosclerosis — sometimes presenting in childhood. Sometimes misdiagnosed as FH because plant sterols cross-react in cholesterol assays.
Lp(a) Elevation
Unlike most lipid traits, plasma Lp(a) is considered to be ~90% genetically determined by variants at the LPA locus, although lifestyle may additionally influence levels via inflammatory signaling and some diet-related factors. For example, some evidence suggests that low carbohydrate diets may decrease Lp(a) in certain individuals, although currently the mechanism is unclear.
Small isoforms of apo(a) tend to result in a higher genetic baseline of Lp(a). Median population Lp(a) is ~20 mg/dL but the distribution is highly skewed — ~20% of people carry levels above 50 mg/dL which is associated with elevated CV risk.
Because of the mass of Lp(a) can vary by the isoform, some lipidologists suggest that Lp(a) should preferentially be measured in nmol/L which measures the number of particles.
Polygenic & Complex Genetics
Polygenic Risk Score (PRS)
An aggregate genetic score summing the weighted effects of thousands of common variants on a quantitative trait (LDL-C, TG, HDL-C, or ASCVD risk directly). Each individual variant has a small effect; in aggregate they explain a meaningful fraction of the population variance in lipid levels and cardiovascular risk.
Causal Inference
Mendelian Randomization (MR)
An epidemiological method using genetic variants as instrumental variables — proxies for a lifetime exposure — to estimate causal effects on outcomes, exploiting the random allocation of alleles at conception as a natural experiment. Key assumptions: (1) The genetic variant is robustly associated with the exposure (relevance). (2) The variant is independent of confounders (independence). (3) The variant affects the outcome only through the exposure (exclusion restriction).
Horizontal Pleiotropy
When a genetic variant affects the outcome through pathways other than the primary exposure of interest. This violates the exclusion restriction assumption and can bias MR estimates. For example, if a ‘LDL-C genetic instrument’ also independently affects blood pressure, its effect on CV events cannot be attributed entirely to LDL-C.
Methods like MR-Egger regression, weighted median, and MR-PRESSO are sensitivity analyses designed to detect and correct for horizontal pleiotropy — essentially attempts at quality checks when interpreting any MR study.
Vertical Pleiotropy
When a genetic variant affects both the exposure and the outcome, but only through the causal pathway under study. This is acceptable in MR and does not violate the exclusion restriction.
Exclusion Restriction Assumption
The third and most frequently violated core assumption of Mendelian randomization. Requires that the genetic instrumental variable affects the outcome only through the exposure of interest — not through any other biological pathway.
The exclusion restriction is untestable directly. MR analyses rely on biological plausibility, sensitivity analyses, and testing instruments from different biological mechanisms to evaluate whether results are robust to potential violations.
Instrumental Variables (IV)
Genetic variants used in Mendelian randomization as instruments for a modifiable exposure. A valid IV must be (1) strongly associated with the exposure, (2) independent of confounders, and (3) only related to the outcome through the exposure. Weak instruments (low F-statistic) introduce bias toward the observational estimate.
Colocalization
A statistical analysis that tests whether the same genetic variant is driving association signals for two traits simultaneously (e.g., LDL-C and coronary artery disease). If the same SNP drives both associations, this strengthens the causal argument; if different SNPs underlie each, it may suggest confounding or pleiotropy.
5. Biomarkers & Advanced Testing
Lipid Metrics & Ratios
ApoB
The direct plasma measure of total particle number across all ApoB-containing lipoproteins. One ApoB per particle. Captures LDL, VLDL, IDL, Lp(a), and chylomicrons in a single number. Measured by immunoassay. Endorsed as a primary or co-primary treatment target by multiple international lipid guidelines.
In mainstream lipidology, ApoB is considered the most informative single lipid test for cardiovascular risk stratification. It outperforms LDL-C in people with elevated TG, insulin resistance, or discordant lipid patterns — though as with all lipid markers, the metabolic context in which it is elevated may be relevant.
Non-HDL-C, LDL-C, HDL-C, TG
These terms are defined in detail in Section 1. In the context of the biomarker panel, the key clinical point is how they relate to each other.
The standard lipid panel (TC, LDL-C, HDL-C, TG) provides a starting point. Its limitations: LDL-C is calculated (not directly measured in most labs), fails at high TG, and captures neither particle number nor remnant burden fully.
LDL-C/ApoB Ratio
The ratio of LDL cholesterol to ApoB concentration. Reflects the average cholesterol content per LDL particle. A low ratio = many small, cholesterol-poor particles (Pattern B, high ApoB per unit LDL-C). A high ratio = fewer, cholesterol-rich, large buoyant particles (Pattern A, lower ApoB per unit LDL-C).
In LMHR individuals, the LDL-C/ApoB ratio is often high (>1.2) — consistent with large, buoyant LDL. This distinguishes the LMHR pattern from the metabolic syndrome pattern where the ratio is low (many small dense particles).
TG/HDL-C Ratio
A simple surrogate for insulin resistance and small dense LDL predominance. A higher ratio is associated with Pattern B dyslipidemia and metabolic dysfunction. Easy to calculate from a standard fasting lipid panel.
The TG/HDL-C ratio is often considered one of the most informative simple metrics derivable from a standard lipid panel because it can be used as a proxy measure for metabolic health. However, it can be helpful to take the ratio in context, as some factors increase triglycerides without decreasing HDL-C - like habitual alcohol consumption, or caffeine during the fasting period.
Remnant Cholesterol
(Defined in Section 1.) Calculated as TC − HDL-C − LDL-C from a standard fasting panel.
Lp(a)
(Defined in Section 1.) Measured in mg/dL or nmol/L — an important distinction. Nmol/L measures particle number; mg/dL measures mass (which includes Apo(a) protein, size of which varies between individuals). Many guidelines now prefer nmol/L.
Advanced Lipid Testing
NMR Lipoprofile (LDL-P, LPIR)
Nuclear Magnetic Resonance spectroscopy of a plasma sample measuring lipoprotein particle concentrations directly (LDL-P, HDL-P, VLDL-P) and particle sizes. Also generates LPIR (Lipoprotein Insulin Resistance Index) — a score derived from six particle metrics that correlates with insulin resistance and predicts type 2 diabetes.
In LMHR individuals on low-carb diets: LDL-P and ApoB rise, but many LMHR report LPIR falling substantially — a metabolic divergence that standard panels cannot capture and that may factor in to the LMHR risk question.
Ion Mobility
An alternative method to NMR for lipoprotein particle sizing and quantification. Uses differential electrical mobility of particles in a gas phase. Provides high-resolution particle size distribution data. Pioneered by Ronald Krauss.
ApoB Immunoassay
Direct immunoturbidimetric or immunonephelometric measurement of ApoB in plasma. Widely available in clinical laboratories, inexpensive, and robust. Does not require fasting. Now endorsed by the American Heart Association and European Atherosclerosis Society as a preferred risk marker.
Sterol / Cholesterol Balance Testing
Plant Sterols (Sitosterol, Campesterol)
Absorbed from dietary plant foods via NPC1L1; normally kept very low by ABCG5/G8 efflux back into the gut. Elevated plasma levels indicate high intestinal cholesterol absorption efficiency — the hyperabsorber phenotype.
Synthesis Markers (Desmosterol, Lathosterol)
Precursors in the cholesterol biosynthesis pathway. Lathosterol is a late-stage intermediate in the Kandutsch-Russell branch of cholesterol synthesis; desmosterol marks the Bloch branch. Both are elevated when endogenous cholesterol synthesis is high — identifying the hypersynthesizer phenotype
Metabolic Markers
Insulin / C-Peptide / HOMA-IR
Fasting insulin reflects insulin secretory demand and is elevated in insulin resistance. C-peptide is co-secreted with insulin and is a more stable measure of endogenous insulin production. HOMA-IR = fasting insulin (µU/mL) × fasting glucose (mmol/L) / 22.5 — a validated surrogate for insulin resistance.
C-peptide is one of the most sensitive early markers of metabolic dysfunction, often rising years before fasting glucose or HbA1c crosses clinical thresholds. Elevated c-peptide is associated with VLDL overproduction, high TG, low HDL-C, and Pattern B — the full atherogenic dyslipidemia.
HbA1c
Glycated hemoglobin — reflects average blood glucose over the preceding ~3 months. Standard diagnostic and monitoring tool for diabetes and prediabetes. A component of comprehensive cardiometabolic risk assessment alongside lipids.
HbA1c is less sensitive than fasting insulin for detecting early insulin resistance — it only rises once glycemic dysregulation is established.
Adiponectin
An adipokine (fat tissue-derived hormone) with insulin-sensitizing, anti-inflammatory, and fatty acid oxidation-promoting properties. Inversely associated with BMI, visceral adiposity, and insulin resistance. Low adiponectin is a feature of metabolic syndrome.
Adiponectin is suggested to be anti-atherogenic through multiple pathways: improved insulin sensitivity, reduced VLDL overproduction, suppressed endothelial inflammation, and increased fatty acid oxidation in muscle. Its reduction with visceral fat accumulation may be a mechanistic link between obesity and dyslipidemia.
Homocysteine
A sulfur-containing amino acid produced during methionine metabolism. Elevated plasma homocysteine (hyperhomocysteinemia) is associated with endothelial damage, increased thrombosis risk, and CV events. Raised by B12, B6, and folate deficiency, chronic kidney disease, and certain genetic variants (MTHFR).
GlycA
(Defined in Section 3 under Inflammation.) In the biomarker context: measured on the same NMR lipoprofile panel that generates LDL-P and LPIR. Provides a composite systemic inflammation score from a single blood draw alongside particle data.
The practical value of GlycA on an NMR panel: it allows simultaneous assessment of particle burden (LDL-P), metabolic health (LPIR), and systemic inflammation (GlycA) — a three-dimensional metabolic snapshot from one test.
6. Phenotypes & Models (TFP_-Relevant)
Phenotypes
LMHR (Lean Mass Hyper-Responder)
A phenotype observed predominantly in lean, metabolically healthy, and often physically active individuals who adopt very-low-carbohydrate (ketogenic or near-ketogenic) diets. Characterized by a distinct lipid triad: LDL-C exceeding 200 mg/dL, HDL-C above 80 mg/dL, and TG below 70 mg/dL — occurring simultaneously. First systematically described and named by Dave Feldman.
The central scientific question surrounding LMHR is not whether LDL-C is elevated — it clearly is — but whether this elevation in this specific metabolic context (lean, insulin-sensitive, low TG, high HDL, low inflammation) carries equivalent atherosclerotic risk to LDL-C elevation occurring in the context of insulin resistance, obesity, and dyslipidemia. Prospective CAC and CCTA data are accumulating to answer this.
Hyperabsorber
An individual with constitutively high intestinal cholesterol absorption, identifiable by elevated plasma sitosterol and campesterol on a sterol panel.
Hypersynthesizer
An individual with constitutively elevated endogenous cholesterol synthesis, identifiable by elevated lathosterol and/or desmosterol on a sterol panel. HMG-CoA reductase activity is high, driving excess hepatic cholesterol production.
Hypersynthesizers are at the other end of the synthesis/absorption spectrum from hyperabsorbers. Some clinicians use their understanding of these phenotypes to individualize lipid therapy selection to the phenotype of the patient.
Metabolic Syndrome / Insulin-Resistant Phenotype
A cluster of interrelated metabolic abnormalities driven by insulin resistance and visceral adiposity. Lipid phenotype: elevated TG, low HDL-C, small dense LDL (Pattern B), elevated remnant cholesterol, and elevated ApoB — often with normal or only modestly elevated LDL-C.
In metabolic syndrome, ApoB level may be higher than the individual’s LDL-C level may suggest — an individual may have LDL-C of 100 mg/dL but ApoB of 130 mg/dL or above, with many small dense LDL particles. This is the opposite of the LMHR pattern and illustrates why phenotypic context may play a role in interpreting lipid values.
Conceptual Models
Lipid Energy Model (LEM)
A hypothesis developed by Dave Feldman and colleagues proposing that in lean, metabolically healthy, carbohydrate-restricted individuals, the observed elevation in LDL-C and ApoB reflects upregulated lipid mobilization and systemic transport to deliver fatty acids and ketones for energy — a physiological adaptation to absence of dietary carbohydrate, not a dysregulated atherogenic state. The model generates specific, testable, directional predictions: LDL-C should attenuate when carbohydrate intake is sufficiently increased; it should track with energy demand markers.
The LEM remains a hypothesis — it has reasonable mechanistic plausibility and directional n-of-1 predictions, but long-term prospective imaging data in LMHR individuals are required (and being collected) to establish whether this LDL-C elevation translates to plaque accumulation at the rate standard risk equations would predict.
Discordance
The clinical phenomenon where two markers expected to correlate do not. In lipidology, most commonly: LDL-C vs. ApoB. High LDL-C with low ApoB = large, buoyant, cholesterol-rich particles (Pattern A — fewer trucks, more cargo each). Low LDL-C with high ApoB = small, dense, cholesterol-poor particles (Pattern B — more trucks, less cargo each). The second pattern has higher CV risk per unit of LDL-C.
The LMHR phenotype characteristically shows high LDL-C with proportionally lower ApoB — a Pattern A discordance suggesting fewer (in proportion), larger, cholesterol-rich particles. The metabolic syndrome shows the opposite. Understanding discordance direction may be helpful in guiding risk interpretation in non-standard lipid patterns.
Response-to-Retention Hypothesis
The foundational mechanistic model of atherosclerosis initiation endorsed by mainstream cardiology. Proposes that the primary initiating event is the retention of ApoB-containing lipoproteins in the subendothelial matrix — via binding of ApoB to proteoglycans — where they are then modified, oxidized, and taken up by macrophages. The endothelium is not simply a passive barrier; it is a selective filter, and ApoB retention behind it is the pathogenic trigger.
7. Clinical Outcomes & Disease States
Major Cardiovascular Events
MACE (Major Adverse Cardiovascular Events)
A composite clinical trial endpoint. 3-point MACE: cardiovascular death, non-fatal MI, non-fatal ischemic stroke. 4- or 5-point MACE adds revascularization and/or hospitalization for unstable angina. The primary endpoint in most large CV outcomes trials.
The specific MACE definition varies between studies — always verify components before comparing effect sizes. A 15% MACE reduction means something different when the composite includes softer endpoints like revascularization versus harder ones like CV death.
CHD Events / STEMI / NSTEMI
CHD events include any manifestation of coronary heart disease: stable angina, unstable angina, NSTEMI (non-ST-elevation myocardial infarction — partial coronary occlusion, troponin elevation, no ST elevation on ECG), and STEMI (ST-elevation MI — typically complete coronary occlusion, ST elevation, requiring emergent revascularization).
STEMI and NSTEMI differ in mechanism as well as ECG appearance: STEMI most commonly results from plaque rupture and complete thrombotic occlusion; NSTEMI more often reflects plaque erosion or partial occlusion. Lipid-rich plaque burden is the shared upstream risk factor for both.
Ischemic Stroke / CV Death
Ischemic stroke — cerebral infarction due to arterial occlusion — is part of the MACE composite and is causally linked to atherosclerosis (carotid and intracranial) and cardioembolic sources. CV death includes death from coronary heart disease, stroke, arrhythmia, and heart failure.
Other Lipid-Related Conditions
Acute Pancreatitis (TG-driven)
Severe pancreatic inflammation triggered by extreme hypertriglyceridemia (typically >880–1000 mg/dL). Chylomicrons obstruct pancreatic microvascular flow; locally hydrolyzed free fatty acids from TG are directly toxic to acinar cells. Recurrent pancreatitis can lead to exocrine insufficiency and chronic pain.
Pancreatitis risk requires a different TG threshold than atherosclerosis risk. Modest TG elevation (150–500 mg/dL) is associated with increased atherosclerotic risk; pancreatitis risk becomes substantial above ~500–880 mg/dL and severe above 1000 mg/dL.
Xanthomas / Xanthelasmas
Xanthomas: lipid deposits in skin and tendons. Types include tendon xanthomas (Achilles, extensor tendons — classic for FH), tuberous xanthomas (over joints — seen in hoFH and Type III), and eruptive xanthomas (small papules over buttocks/trunk — pathognomonic for severe hypertriglyceridemia). Xanthelasmas are periorbital cholesterol deposits, more common but not specific for hyperlipidemia.
Lipemia Retinalis
Creamy-white appearance of retinal blood vessels on fundoscopy caused by light scattering through TG-laden chylomicrons in retinal capillaries. Occurs at TG levels typically above 2000–3000 mg/dL. Pathognomonic for severe chylomicronemia.
NAFLD / MASLD
Non-Alcoholic Fatty Liver Disease / Metabolic Dysfunction-Associated Steatotic Liver Disease. Hepatic fat accumulation (steatosis) driven by insulin resistance, de novo lipogenesis, and excess free fatty acid flux to the liver. The spectrum includes simple steatosis, MASH (steatohepatitis with inflammation), fibrosis, and cirrhosis. MASLD is the updated nomenclature emphasizing metabolic etiology.
NAFLD/MASLD is strongly associated with elevated TG, low HDL-C, high ApoB, and elevated remnant cholesterol — the full atherogenic dyslipidemia. It is both a consequence of and contributor to insulin resistance and VLDL overproduction.
Calcific Aortic Valve Stenosis
Progressive calcification and stiffening of the aortic valve leaflets leading to obstruction of left ventricular outflow. Shares pathological features with atherosclerosis. Strongly associated with Lp(a) elevation (via OxPL-ApoB-driven osteoblastic differentiation in valve tissue) and with LDL-C.
8. Imaging & Direct Disease Measurement
Imaging Modalities
CAC Scoring (Coronary Artery Calcium Score)
Non-contrast CT quantifying calcified coronary plaque by the Agatston score (area × density weighting). Reflects cumulative lifetime atherogenic burden. Score of 0 = very low near-term event risk; above 100 or at or above the 75th percentile for age/sex/ethnicity = elevated risk.
CAC = 0 is often considered to be one of the most powerful negative risk predictors — sometimes called the “Power of Zero” due to the very low short-moderate term heart disease risk associated in this context.
CCTA (Coronary CT Angiography)
Contrast-enhanced CT of the coronary arteries. Visualizes both calcified and non-calcified plaque, stenosis severity, and high-risk plaque features (LAP, positive remodeling, napkin-ring sign, spotty calcification). The only non-invasive modality that directly characterizes plaque composition.
IVUS (Intravascular Ultrasound)
Catheter-based ultrasound deployed inside the coronary artery during invasive angiography. Provides cross-sectional images of the arterial wall, enabling volumetric plaque quantification (TAV, PAV). The gold standard for serial plaque progression/regression imaging in clinical trials.
OCT (Optical Coherence Tomography)
A high-resolution catheter-based coronary imaging technique using near-infrared light. Spatial resolution ~10x higher than IVUS. Provides detailed imaging of fibrous cap thickness, lipid pool composition, and micro-features of plaque vulnerability (including visualization of TCFA).
OCT is the best available tool for identifying and measuring thin-cap fibroatheromas in vivo. Its high resolution allows direct cap thickness measurement below the 65 µm threshold that defines TCFA — something IVUS cannot reliably do.
CIMT (Carotid Intima-Media Thickness)
Ultrasound measurement of the combined thickness of the intima and media layers of the common carotid artery. A non-invasive marker of subclinical atherosclerosis. Correlates with cardiovascular risk factors and predicts future CV events at the population level.
CIMT has fallen somewhat out of favor as a primary risk stratification tool (CAC scoring outperforms it) but it is still considered useful in younger populations (where CAC is typically 0) and as a research tool for studying early vascular changes.
Cardiac MRI
Magnetic resonance imaging of the heart. Provides excellent assessment of myocardial structure, function, tissue characterization (edema, fibrosis, scar), and great vessel anatomy without radiation. Also enables aortic and carotid plaque characterization in research settings.
Cardiac MRI is the reference standard for myocardial viability assessment after MI, guiding revascularization decisions. In lipid research, it is used for carotid and aortic plaque characterization alongside more commonly used modalities.
Key Measurements
TAV, PAV, LAP, TCFA, and Positive Remodeling are defined in their primary sections (Section 3 and Section 8 above).
9. Study Designs & Evidence Framework
Study Types
Prospective Cohort Study
Participants are enrolled and followed forward in time, with exposures (lipid levels, diet, medications) measured at baseline. Outcomes (MI, stroke, death) are ascertained prospectively. Examples: Framingham Heart Study, UK Biobank, MESA.
Prospective cohort studies establish associations and generate hypotheses. Confounding — the presence of unmeasured factors that correlate with both exposure and outcome — is their primary limitation. They cannot definitively establish causality.
Retrospective Cohort Study
Uses existing data (medical records, claims databases, registries) to reconstruct exposure histories and outcomes for a defined group. Faster and cheaper than prospective studies. Subject to information bias and limited by quality of available data.
Case-Control Study
Compares individuals with a disease (cases) to those without (controls), looking backward to assess prior exposures. Efficient for rare outcomes. Subject to recall bias and selection bias in control selection.
Case-control studies were critical early in establishing the relationship between cholesterol levels and MI risk — before long-term prospective cohort data were available at scale.
Randomized Controlled Trial (RCT)
Participants are randomly assigned to treatment or control conditions. Randomization distributes known and unknown confounders equally between groups, making the RCT the gold standard for establishing therapeutic efficacy. Double-blinding prevents outcome ascertainment bias.
Mendelian Randomization
(Defined in detail in Section 4.) In the study design context: a hybrid approach combining genetic epidemiology with causal inference methodology. Uses genetic variants as natural experiments, bridging the gap between observational associations and RCT-level causal evidence.
Meta-Analysis / Systematic Review
A systematic review comprehensively identifies and synthesizes all studies on a topic using predefined criteria. A meta-analysis statistically combines results across studies to generate pooled effect estimates with greater statistical power than any individual study.
Key Concepts
Confounding
A confounding variable is associated with both the exposure and the outcome, creating a spurious or distorted association. The classic example in lipid epidemiology: people who eat more saturated fat may also exercise less, smoke more, and have higher BMI — making it difficult to isolate the specific effect of dietary fat on CV outcomes in observational studies.
Bias (Selection, Information, Publication)
Selection bias: systematic difference between study participants and the target population. Information/recall bias: systematic errors in measuring or reporting exposures. Publication bias: tendency for positive results to be published and negative results to go unreported, inflating apparent effect sizes in meta-analyses.
Publication bias in nutrition research may be substantial — small studies showing dramatic dietary effects are more likely to be published than null results. This is one reason dietary epidemiology findings must be interpreted with considerably more caution than large RCT data.
Intention-to-Treat (ITT) vs Per-Protocol Analysis
Intention-to-treat analysis includes all randomized participants in their assigned groups regardless of whether they completed treatment. Per-protocol analysis includes only participants who adhered to the protocol. ITT preserves randomization and is the primary approach in RCTs; per-protocol can assess efficacy in ideal adherents.
ITT is conservative by design — it dilutes apparent treatment effects because non-adherent participants in the treatment arm are still counted as treated. This is still considered appropriate for real-world effectiveness questions but can underestimate biological efficacy.
Absolute vs. Relative Risk / NNT / NNH
Relative risk reduction (RRR): the proportional reduction in event rate between treatment and control groups. Absolute risk reduction (ARR): the difference in event rates. Number needed to treat (NNT) = 1/ARR — how many patients must be treated for one to benefit. Number needed to harm (NNH) is the equivalent for adverse effects.
RRR is consistent across risk levels; ARR and NNT vary enormously by baseline risk. A 25% relative risk reduction sounds the same in primary and secondary prevention — but the NNT may be 200 in low-risk primary prevention vs. 15 in very-high-risk secondary prevention. Both numbers matter for informed shared decision-making.
10. Landmark Cohorts & Registries
Framingham Heart Study + Offspring
The Framingham Heart Study (est. 1948) followed residents of Framingham, Massachusetts, prospectively establishing the foundational concept of cardiovascular risk factors — including serum cholesterol, blood pressure, and smoking. The Offspring Study extended surveillance to the second generation, enabling familial lipid research.
Framingham generated the first risk factor paradigm in cardiology. Its limitation: predominantly white, northeastern US population limits generalizability.
MESA (Multi-Ethnic Study of Atherosclerosis)
A diverse prospective cohort (6,814 participants, 45–84 years, six US sites) specifically designed to study subclinical cardiovascular disease across white, Black, Hispanic, and Chinese-American populations. Strong data on CAC, carotid ultrasound, and lipid markers including advanced testing.
MESA data on coronary artery calcium has been foundational for understanding CAC’s risk-reclassification value across ethnic groups and for calibrating CAC-based risk prediction algorithms used in current ACC/AHA guidelines.
UK Biobank
A large-scale biomedical database of over 500,000 UK participants with extensive genetic, imaging, biochemical, and health record data. A major resource for Mendelian randomization, genome-wide association studies, and polygenic risk score development in lipid research.
Western Denmark Heart Registry
A large population-based registry with extensive data on cardiac imaging including coronary CT and CAC scoring. Provides real-world evidence on lipid management, statin use, and imaging-based risk stratification in a large Northern European population.
Particularly valuable for CAC-based risk reclassification data in clinical practice settings — bridging the gap between academic trial populations and routine clinical populations.
ARIC (Atherosclerosis Risk in Communities)
A prospective cohort of ~15,800 adults from four US communities, followed from the mid-1980s. Strong data on LDL-C, lipoprotein subclasses, inflammation markers (hsCRP, fibrinogen), and incident MI, stroke, and heart failure outcomes.
ARIC has been a key source of data on advanced lipid biomarkers (ApoB, LDL-P, sdLDL) in relation to CV outcomes, and on racial disparities in cardiovascular risk and lipid management.
Copenhagen General Population Study (CGPS)
A large Danish prospective cohort (over 100,000 participants) that has generated some of the most cited Mendelian randomization data on remnant cholesterol, Lp(a), and HDL-C causality. The Copenhagen City Heart Study is an earlier related cohort.
11. Dietary & Fatty Acid Context
Major Fatty Acids
Saturated Fat (SFA)
Fatty acids with no double bonds in their carbon chains. Found primarily in animal products (meat, dairy, butter) and some plant oils (coconut, palm). SFA consumption raises LDL-C in most people by reducing hepatic LDL receptor expression and increasing VLDL production — though the magnitude varies substantially between individuals.
MUFA (Monounsaturated Fatty Acids)
Fatty acids with one double bond. Found in olive oil, avocado, nuts, and some animal fats. When used to replace SFA in the diet, MUFA generally produces no change or a slight decrease to the LDL-C/HDL-C ratio without raising TG. The primary fat in the Mediterranean dietary pattern. The primary fat in the Mediterranean dietary pattern.
PUFA (Polyunsaturated Fatty Acids)
Fatty acids with two or more double bonds. Include both omega-6 (linoleic acid and derivatives) and omega-3 (ALA, EPA, DHA) classes. Replacing SFA with PUFA, particularly omega-6, lowers LDL-C more than MUFA. However, the effects on HDL-C, TG, and inflammation vary by PUFA type and context.
Omega-3 Fatty Acids (EPA / DHA / ALA)
EPA (eicosapentaenoic acid) and DHA (docosahexaenoic acid) are long-chain omega-3 fatty acids found in marine sources (fish oil). ALA (alpha-linolenic acid) is the short-chain plant-derived omega-3 found in flaxseed, walnuts, and chia. Human conversion of ALA to EPA/DHA is inefficient (<5–10%).
Omega-6 Fatty Acids (Linoleic Acid)
The dominant PUFA in most Western diets, found primarily in seed oils (soybean, corn, sunflower, safflower). Linoleic acid (LA) is the essential omega-6 fatty acid. High dietary omega-6 relative to omega-3 is a feature of the modern Western dietary pattern.
The omega-6/omega-3 ratio in the typical Western diet is estimated at 15–20:1 versus an evolutionary estimate of 1:1 to 4:1.
12. Key Dietary Intervention Trials (TFP_-Relevant)
MHERO Study (VLCD vs DASH)
A prospective randomized trial comparing a very-low-carbohydrate diet (VLCD) against the DASH diet in patients with hypertension, examining effects on blood pressure, body composition, and cardiometabolic biomarkers including lipids. Ongoing — represents an important head-to-head comparison of two clinically endorsed dietary approaches.
MHERO is notable for its focus on a population (hypertension) where both dietary approaches have clinical credibility, enabling a genuinely informative comparison of their differential lipid effects in a pre-defined high-risk group.
DIETFITS (Gardner et al., JAMA 2018)
A Stanford University 12-month RCT in 609 adults comparing a healthy low-fat diet versus a healthy low-carbohydrate diet for weight loss. Both diets achieved similar mean weight loss and reduced refined starches and added sugars. The low-carbohydrate arm produced greater TG reductions and HDL-C increases; LDL-C responses were heterogeneous across both arms.
KETO-MED
A head-to-head RCT comparing a ketogenic Mediterranean diet (very-low-carbohydrate with Mediterranean fat sources) against a standard Mediterranean diet. The ketogenic arm showed superior improvements in glycemic control, TG reduction, and HDL-C increases, with broadly comparable LDL-C changes in most participants.
Virta Health Trial (Continuous Care Intervention)
A non-randomized but rigorously tracked prospective study of a ketogenic diet delivered through continuous digital care in patients with type 2 diabetes. Two-year results: sustained HbA1c reduction, substantial medication reduction (including insulin), improved TG, improved HDL-C, and weight loss — despite frequent increases in LDL-C in some participants.
The Virta trial is the most detailed longitudinal cardiometabolic dataset on ketogenic diets in a clinical population to date.
A Note on Accuracy
Every definition in this glossary aims to accurately represent both the current scientific evidence and clinical consensus as of 2026.
This is a living reference. As new data emerge, entries will be updated.