

The Metabolic Milieu, Part 1: Does Context Matter for LDL-C?
Part 1 of an evergreen series: does the metabolic environment surrounding LDL-C and ApoB shape how strongly they associate with cardiovascular disease?

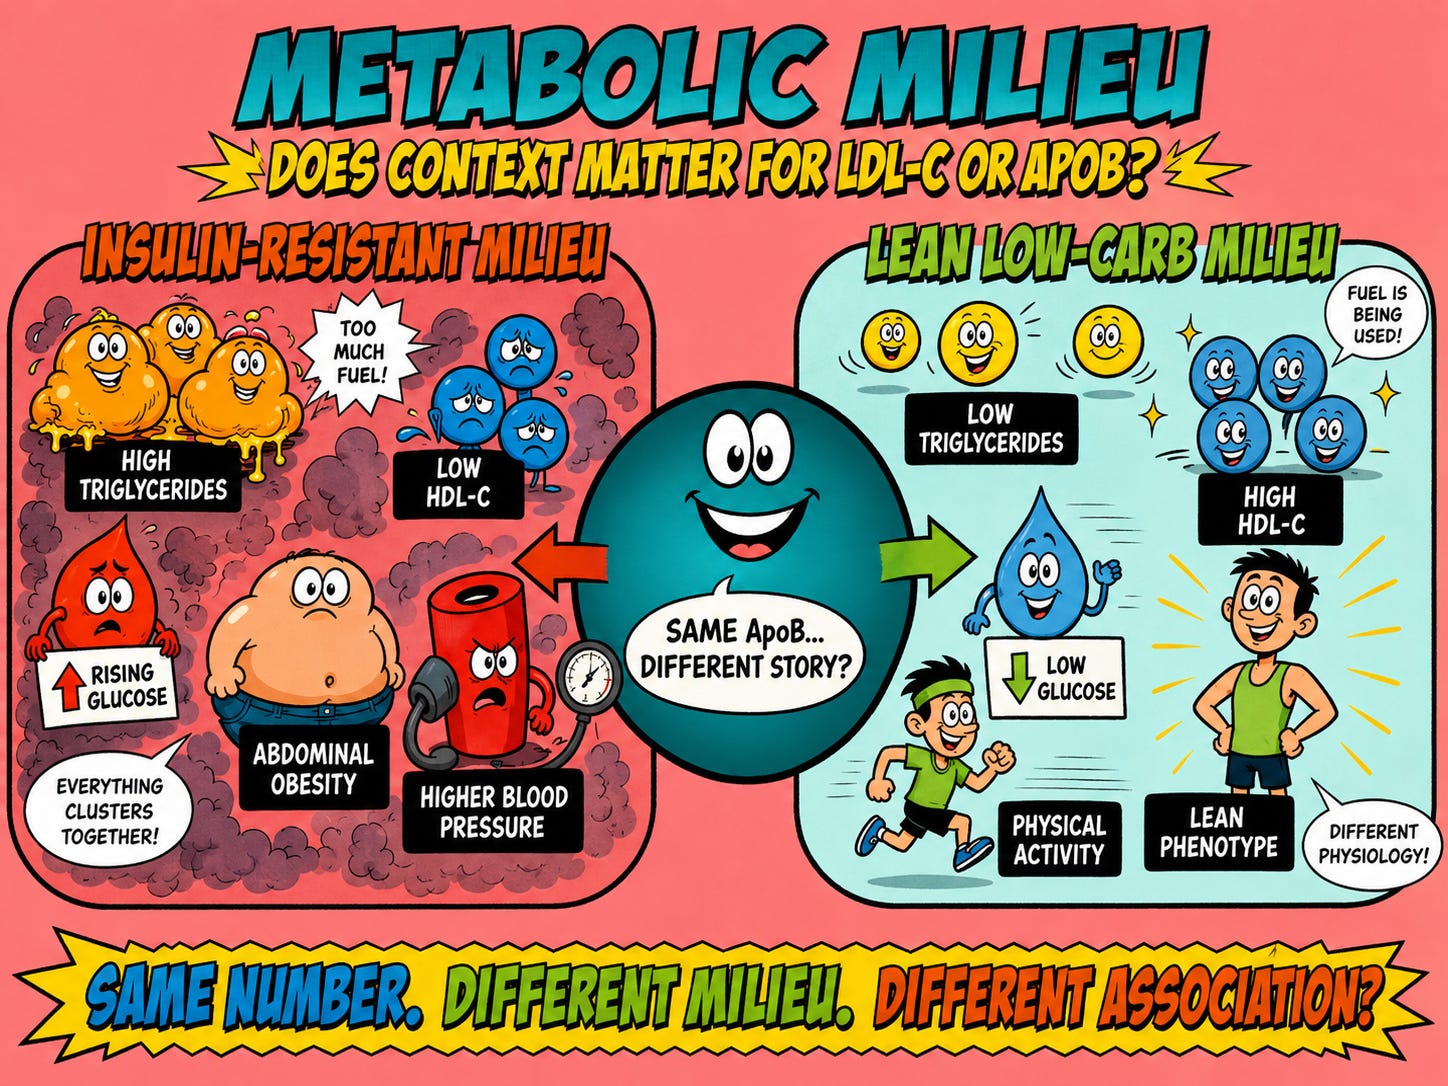
Two people, same ApoB
Let’s take a moment to picture two individuals with the exact same ApoB level.
The first carries some extra weight around their middle, has higher triglycerides (TG) and lower HDL-C, consistently elevated blood pressure readings, and blood sugar creeping up year after year.
The second is lean and physically active, with lower TG and higher HDL-C, no signs of blood pressure issues, optimal fasting glucose, and has adopted a lower carbohydrate diet for years.
They have the same number on the lab report — but the metabolic milieu that gave rise to it may be very different.
Within conventional lipidology, LDL-C and ApoB are generally regarded as part of the causal pathway for atherosclerosis — and ApoB-containing lipoproteins are often discussed as though their association with cardiovascular disease is the same in every scenario: more particles = more risk, and that risk is almost always considered unacceptably high.
But at the end of the day, ApoB may not always arise the same way for the same reasons. So, the question we pose here is…
Does this context even matter? When the same number shows up inside two nearly opposite metabolic environments, does it carry the same association with heart disease in both?
ApoB may rise for different reasons: starting with insulin resistance
One of the most common settings in which ApoB rises is insulin resistance, which tends to cluster with other traits associated with chronic disease: abdominal obesity, higher blood pressure, higher TG, lower HDL-C, and elevated blood sugar12.
In insulin resistance, the body is often handling more incoming energy than its tissues such as muscle or fat can readily use or store. Insulin signaling becomes less effective at holding fatty acids inside fat cells, so lipolysis increases and more fatty acids spill into the bloodstream and travel to the liver.
Some accumulate in the liver itself — contributing to conditions like fatty liver disease, which may further blunt insulin signaling — while others are repackaged into TG-rich VLDL particles and sent back into circulation.
But the tissues receiving that fatty fuel are often already flush with energy, and thus these metabolic conditions can alter how efficiently these particles are processed. As VLDL particles unload only part of their TG payload, they leave behind remnants that may remain in circulation.
Combined with changes in lipoprotein remodeling that can further impair their clearance by the liver, the result is a larger circulating pool of ApoB-containing particles emerging in the context of an environment consistent with metabolic dysfunction.
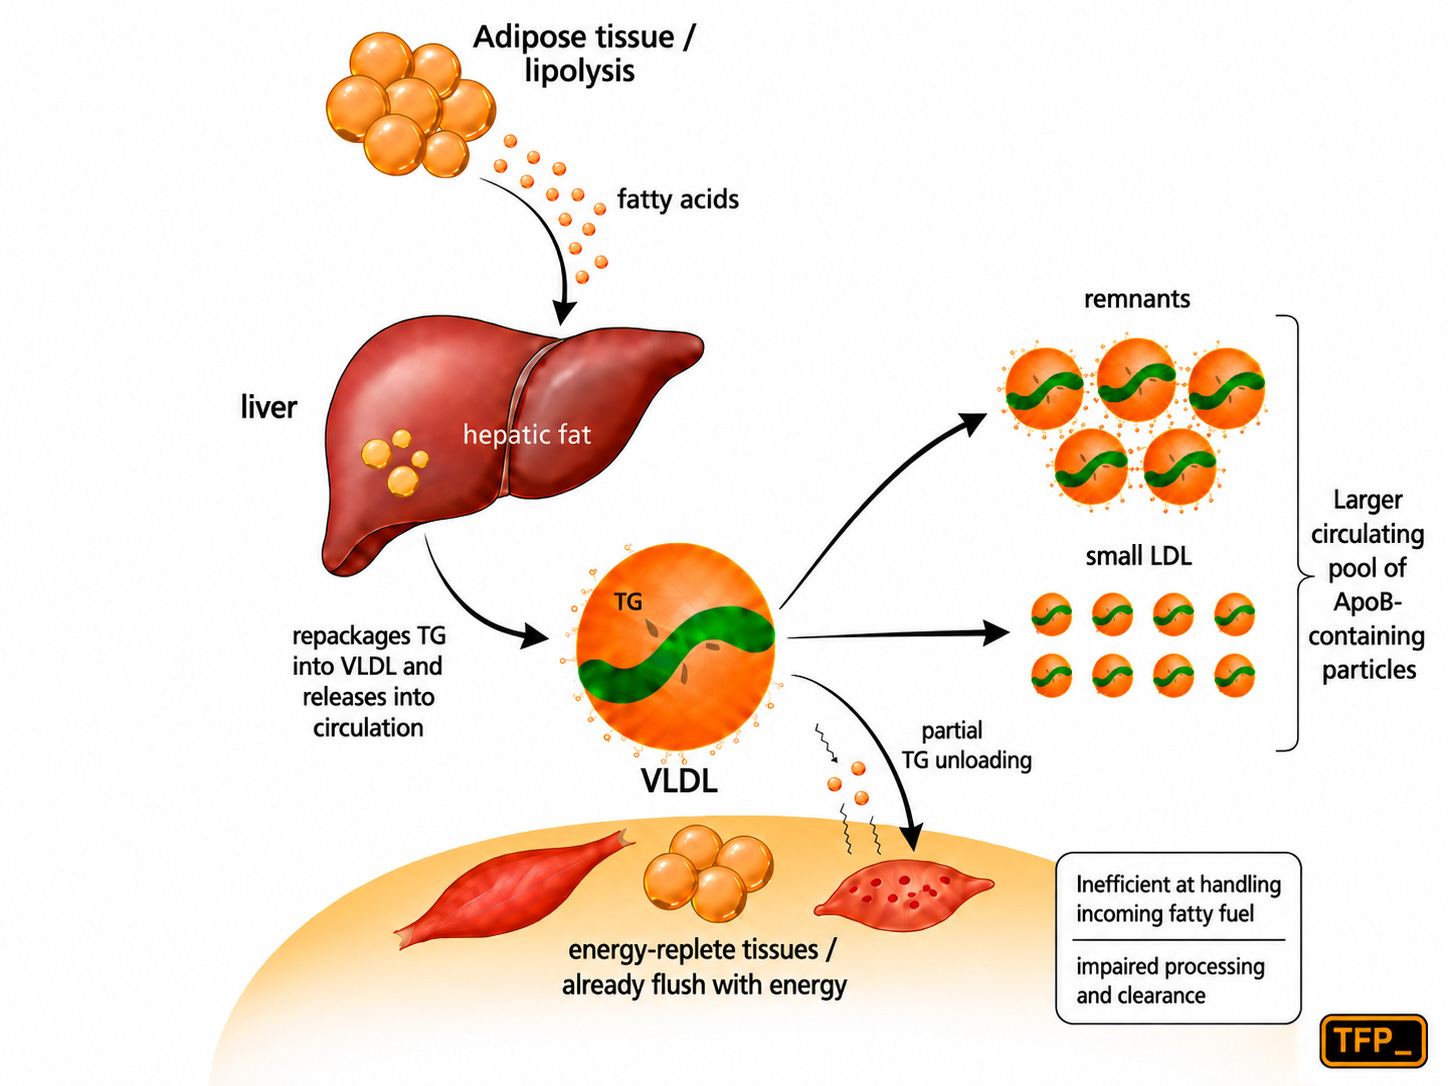
Figure 1: Simplified illustration of lipid trafficking in insulin resistance, showing increased fatty-acid delivery to the liver, VLDL production, and less efficient processing and clearance of ApoB-containing particles.
Note: if any of the terminology here is unfamiliar, our Glossary of Terms here is a good place to start.
ApoB may rise for different reasons: moving to lean mass hyper-responders
In some lean people eating a very-low-carbohydrate diet, the proposed physiology may result in a much different path to a given ApoB level. Under the Lipid Energy Model (LEM)3, greater reliance on fat for fuel creates increased peripheral demand for fatty acids.
The liver exports TG in VLDL, those TG are rapidly unloaded and utilized for energy, and the VLDL particles are progressively remodeled into LDL particles. Along the way, surface components shed from the VLDLs may be mopped up by HDL, in turn, increasing HDL-C as TG levels fall.
For more details, see our free LMHR article here.
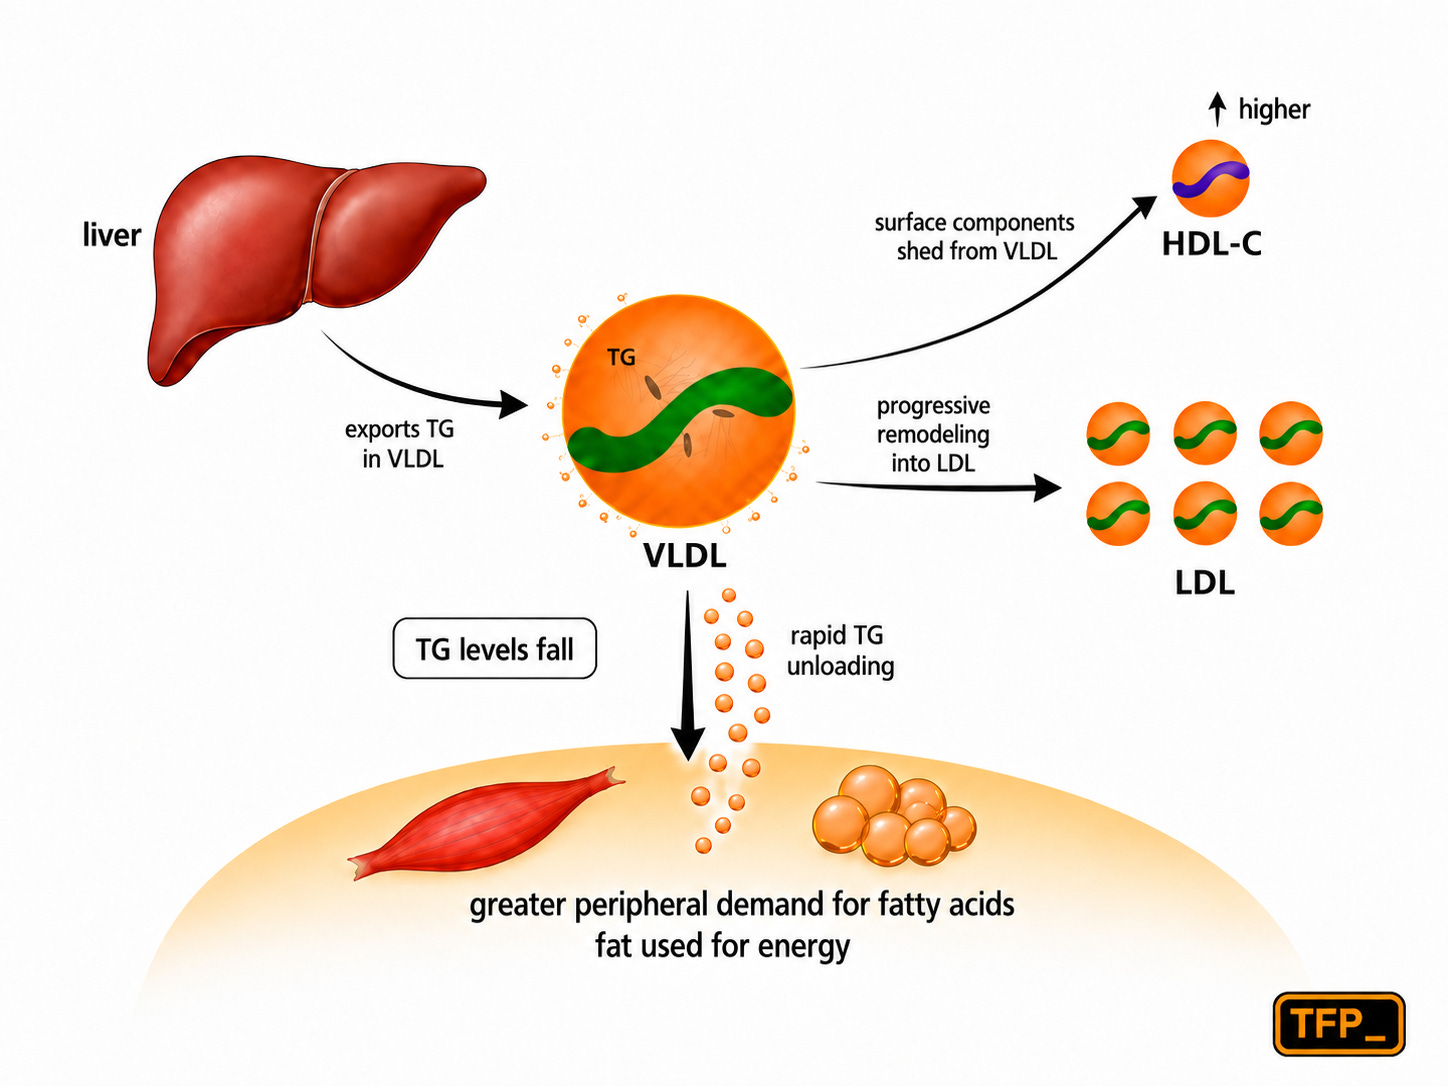
Figure 2: Simplified illustration of the proposed LEM pathway, showing VLDL delivering TG for energy, remodeling into LDL, and contributing to higher HDL-C as TG fall.
So, in one setting, ApoB climbs alongside an oversupply of energy and impaired handling of fuel. On the other hand, the LEM posits increased trafficking and use of fat to meet much-needed peripheral energy demand — perhaps adaptive physiology with more ApoB left in the process.
The question this series explores
If the number can arise from such different circumstances, this poses an obvious question:
Does the association between elevated LDL-C or ApoB and cardiovascular disease look the same when the surrounding metabolic milieu looks different?
Plenty of papers hint at answering this question. We will continue to publish in this series and compile papers that let us look at LDL-C and ApoB through markers associated with metabolic health such as TG/HDL-C levels, fasting insulin, some advanced lipoprotein metrics, and more.
We’ll start with well-known metrics: the TG and HDL-C levels.
The Copenhagen Male Study: our starting point
The Copenhagen Male Study4 followed 2,906 men, ages 53 to 74, who were free of ischemic heart disease (IHD) at baseline. Over 8 years, 229 of them had a first IHD event.
Participants were divided into three groups based on their fasting TG and HDL-C:
Low TG–high HDL-C (TG ≤97 mg/dL and HDL-C ≥57 mg/dL) — a profile typically consistent with insulin sensitivity
High TG–low HDL-C (TG ≥142 mg/dL and HDL-C ≤46 mg/dL) — a profile typically consistent with insulin resistance
Intermediate — everyone else
Of note, TG and HDL-C are not always perfect reflections of metabolic health, but they often give useful clues about the current state of a person’s milieu.
And in this particular study, IHD incidence differed significantly across the TG and HDL-C groups.
Men with high TG and low HDL-C had an 8-year IHD incidence of approximately 12.2%, compared with 4.5% among men with low TG and high HDL-C—a ~2.7-fold difference (see Figure 3).
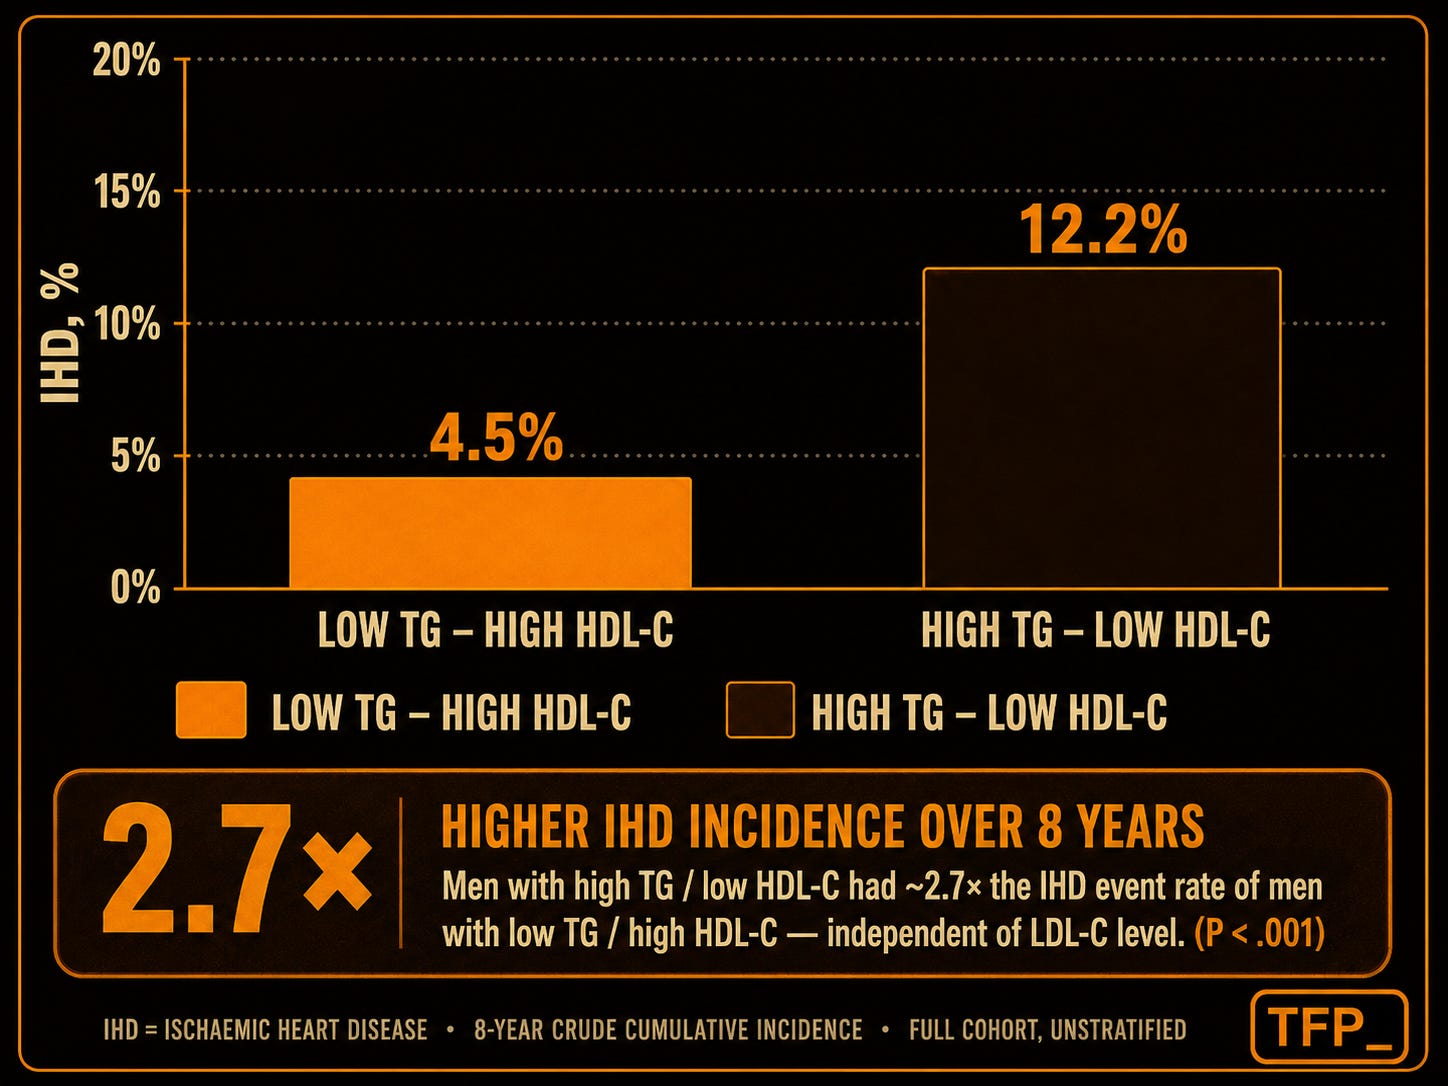
Figure 3: Crude cumulative incidence in the Copenhagen Male Study by TG and HDL-C level.
This higher incidence of events with higher TG and lower HDL-C is commonly observed in many data sets, but the more interesting question here is:
What happened to LDL-C in the lower TG and higher HDL-C group?
Higher LDL-C, but similar event rates
Among the men with low TG and high HDL-C, the researchers split participants by LDL-C above and below 170 mg/dL, approximately the median. Over 8 years:
LDL-C ≤170 mg/dL: 15 events in 347 men — about 4.3%
LDL-C >170 mg/dL: 9 events in 181 men — about 5.0%
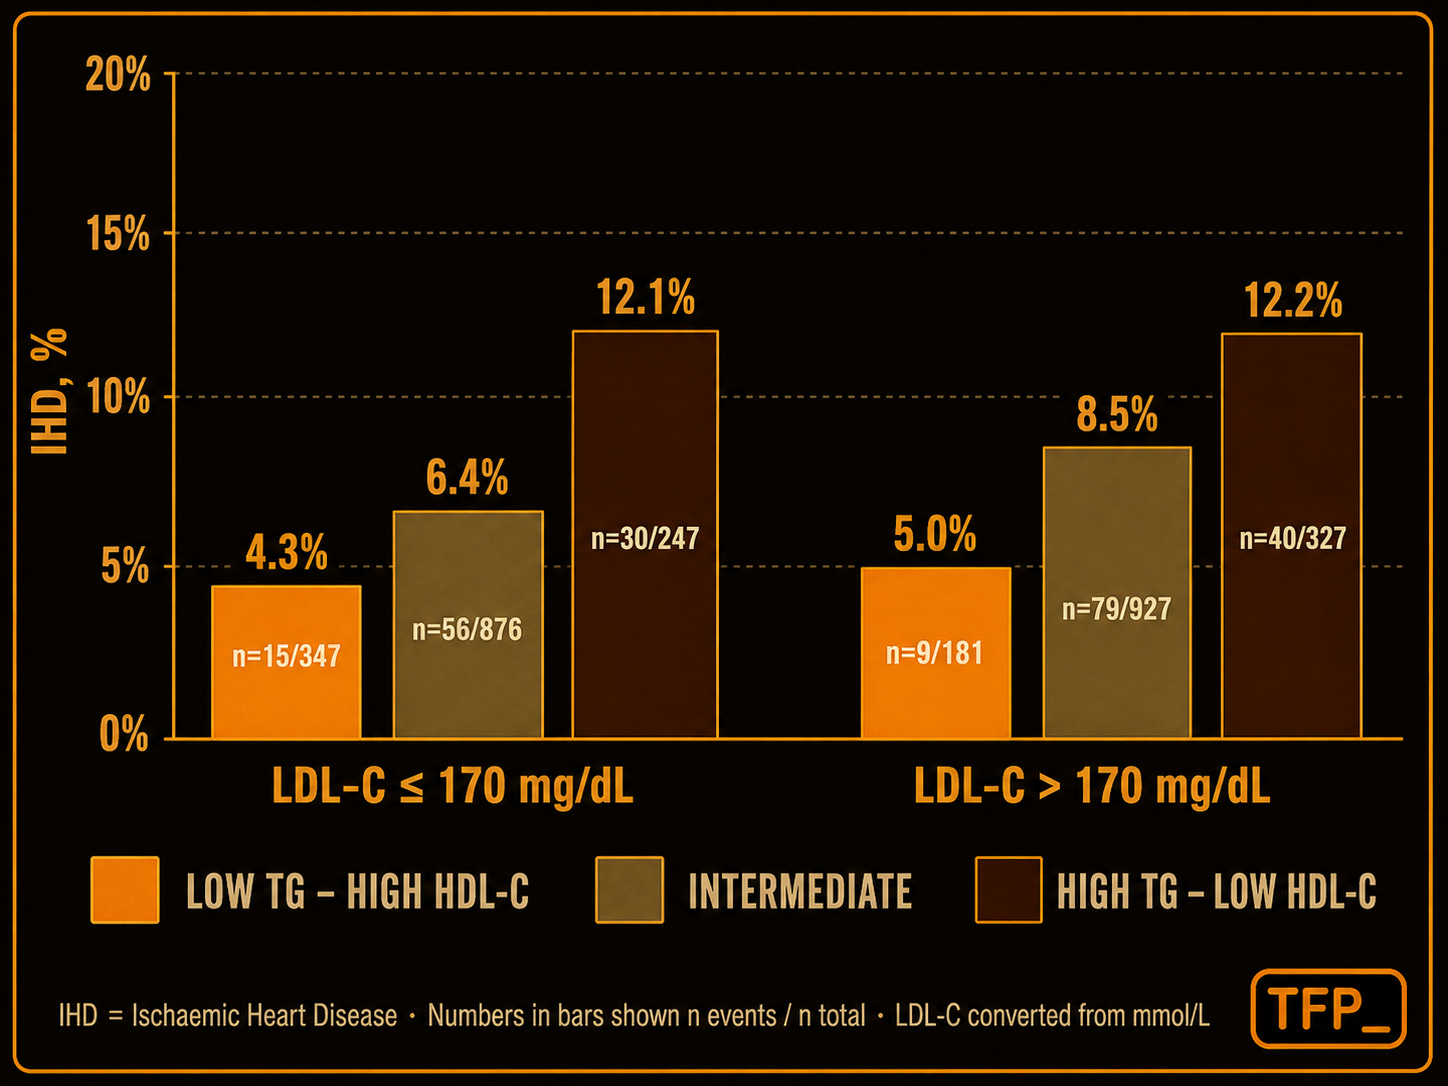
Figure 4: Incidence of ischemic heart disease in the Copenhagen Male Study, stratified by LDL-C level within the low-TG/high-HDL-C phenotype.
That is an absolute difference of ~0.7% over 8 years.
Put differently, if you followed 1,000 men with low TG/HDL-C for 8 years:
About 957 out of 1000 men would be expected to remain event-free in the lower LDL-C group.
About 950 out of 1000 men would be expected to remain event-free in the higher LDL-C group.
That is a difference of about 7 extra events per 1,000 men over 8 years (see Figure 5).
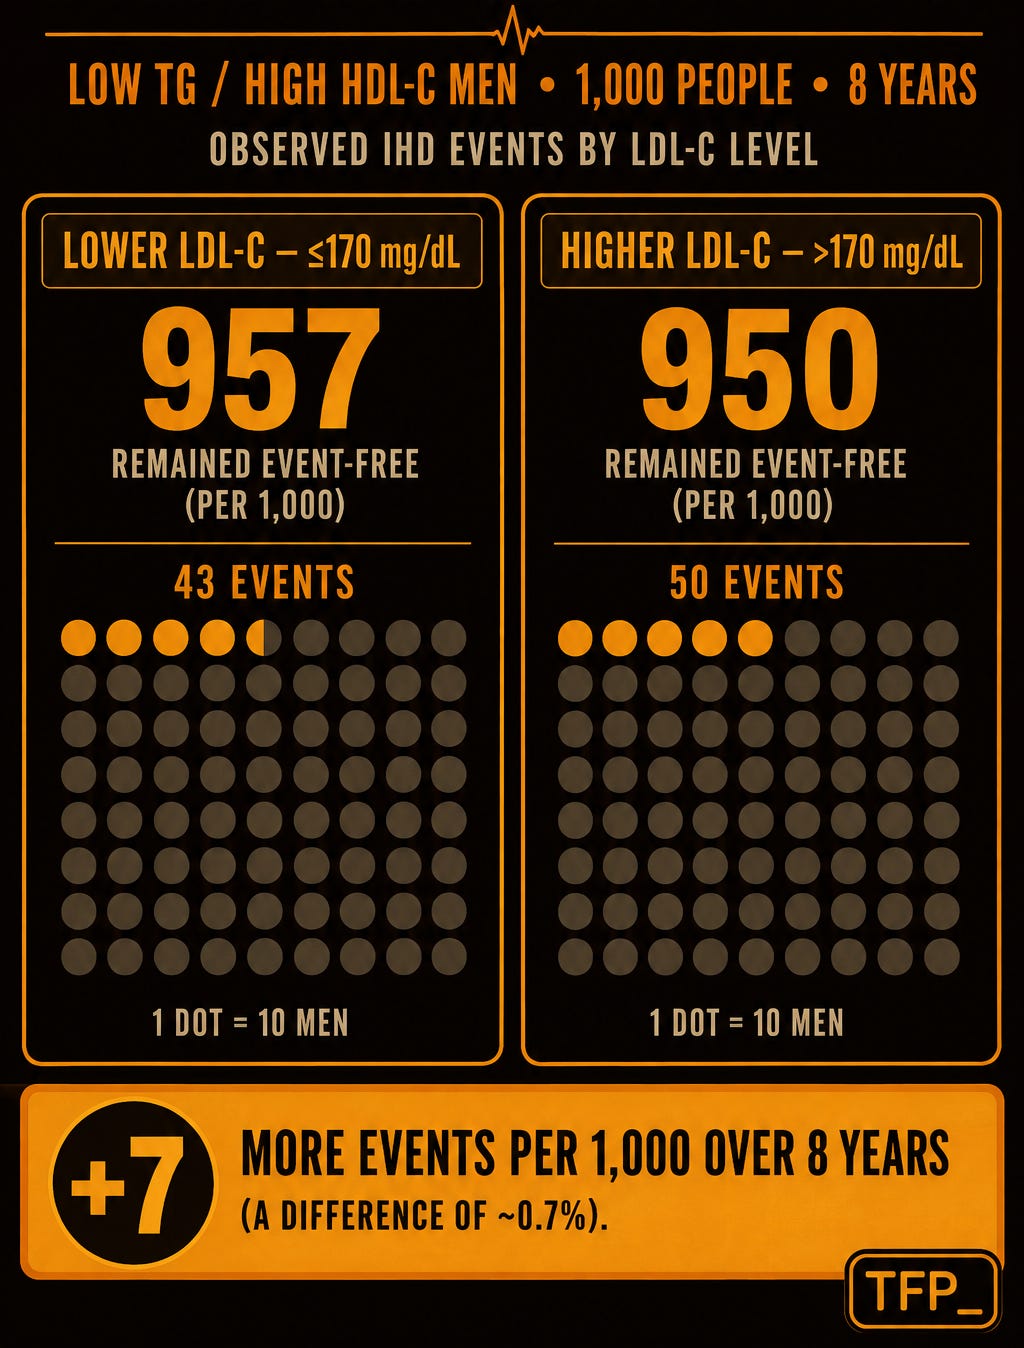
Figure 5: A practical illustration of how absolute differences can appear modest when viewed in population terms.
At first glance that looks like a small difference.
But to be fair, there are important limitations to consider.
The LDL-C contrast here was relatively modest — below and above 170 mg/dL. We don’t know what the picture would look like with a wider spread, say LDL-C below 100 mg/dL versus above 200 mg/dL or analyzed as a continuous variable.
The subgroups also had relatively few events, limiting statistical power and widening the uncertainty around the estimates.
This was only men, aged 53 to 74, and nearly all of European descent — so the findings may not be generalizable to other populations.
Thus, a more careful summary may be this:
In this particular subgroup of men with low TG and high HDL-C, the absolute difference in ischemic heart disease incidence between lower and higher LDL-C was generally small.
And it wasn’t only LDL-C
The Copenhagen data also showed something else interesting. Across other well-established characteristics that associate with heart disease like smoking and lower physical activity, a similar pattern was present: men with low TG and high HDL-C generally had lower IHD incidence within those strata as well. The association with hypertension was similar but pointed to something important that we touched on earlier.
Markers of metabolic dysfunction tend to cluster together— a property called collinearity. Of all the men with hypertension in the cohort, less than 14% had lower TG and higher HDL-C — and, of note, this group accounted for less than 5% of all IHD events among hypertensive men.
The insulin-sensitive lipid pattern and high blood pressure were less likely to occur together, whereas higher TG and lower HDL-C tended to associate with higher BMI, diabetes, lower physical activity (and high blood pressure too).
This collinearity is exactly why isolating the independent contribution of any single metric/characteristic like LDL-C or ApoB can be quite challenging.
We are not attempting to draw the conclusion that smoking, hypertension, physical activity or LDL-C are completely irrelevant when TG are lower, and HDL-C is higher, rather the incidence associated with any one characteristic may be different depending on the metabolic milieu in which it operates.
Where this leaves us
The Copenhagen Male Study may be a useful opening because it’s simple and observational — which can be helpful for hypothesis generation. But it leaves a few gaps. In particular, it looked at LDL-C, not ApoB. And conventional lipidology generally considers ApoB the stronger marker for cardiovascular disease.
So naturally, the next question is whether the same phenomenon survives when we look specifically at ApoB.
If ApoB is the better marker, does the metabolic milieu still seem to change how strongly it tracks with heart disease — or does ApoB capture the full association with heart disease independent of the environment?
That’s where the Quebec Cardiovascular Study kicks in, by pairing ApoB with fasting insulin. We’ll pick it up there in next week’s newsletter.
This is Part 1 of our Metabolic Milieu series. As always, we’d encourage you to read the underlying papers, note the limitations, and resist the urge to oversimplify complex biology.
Whenever I tell people I'm on keto, they inevitably ask about my cholesterol. If I tell them my LDLc is around 165, that's the open and shut case to the laymen that keto is dangerous and ill-advised. The struggle for me is forming an appropriately accurate yet simple 2 sentence response to the question: "but what about your cholesterol?“
This answer doesn't seem compelling: "Essentially all of my other health markers are optimal, and there's evidence to suggest that the effects of elevated LDLc can be substantially attenuated by other optimal health markers. You've never heard your doctor or any other authority make this controversial point and you probably don't know the meaning of attenuated, but please trust me."