


Picking up where we left off
In Part 1, we examined the Copenhagen Male Study1 which gave us our first look at some answers for the overarching question behind this series:
Does the metabolic milieu change the association between LDL-related metrics and heart disease?
So what did we find? Among men with lower TG and higher HDL-C — generally considered more metabolically healthy:
Higher LDL-C (>170 vs ≤170 mg/dL, the cohort median) was associated with a relatively small difference in ischemic heart disease (IHD) incidence
The absolute event rate stayed fairly low across both LDL-C subgroups — less than half the rate in the higher-TG/lower-HDL-C group.
But Copenhagen certainly has some limitations. In particular, it looked at LDL-C, and conventional lipidology generally considers ApoB the stronger predictor of cardiovascular risk. So, the question we ended our last article on was:
If ApoB is the better marker, does the metabolic milieu still seem to change how strongly it tracks with heart disease — or does ApoB capture the full association with heart disease independent of the environment?
The Quebec Cardiovascular Study2 gives us some insights here — by pairing ApoB with one of the most popular metrics in the metabolic health community: fasting insulin.
First, a point we touched on earlier
Recall the collinearity point from Part 1. Markers of metabolic dysfunction tend to cluster together, which makes isolating the independent association between any one of them and heart disease quite challenging. ApoB may be no exception — in many populations, higher ApoB may track alongside higher TG, lower HDL-C, higher blood pressure, and impaired glucose handling3.
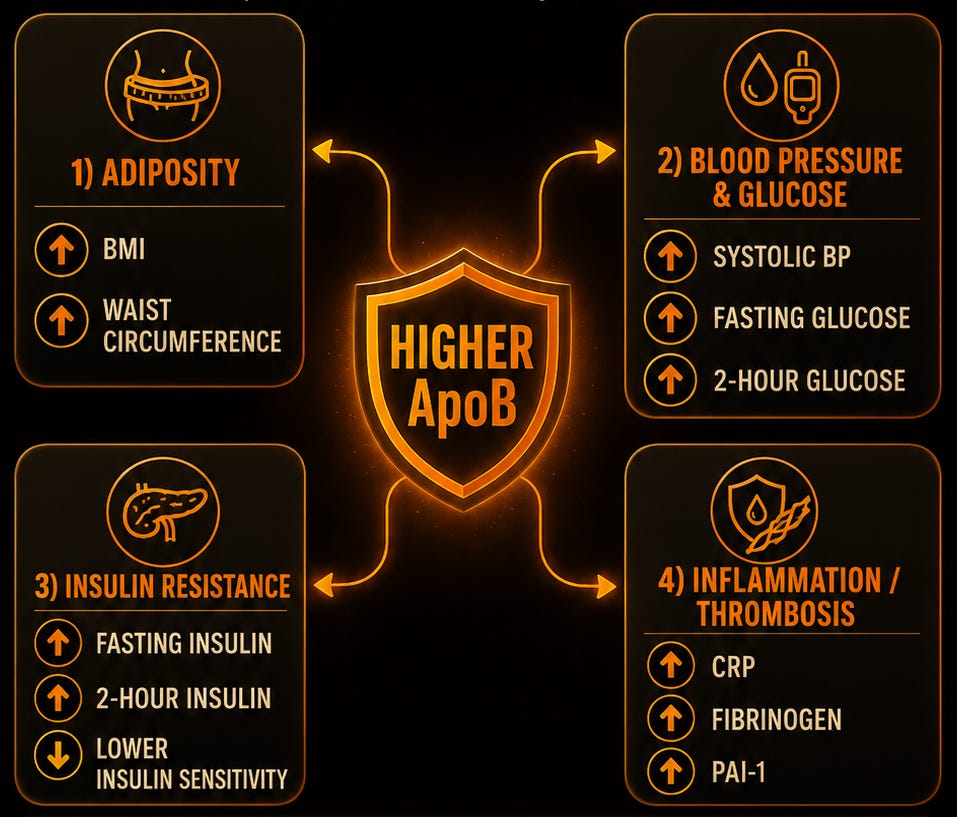
Figure 1. Associations between higher ApoB and features of metabolic dysfunction in the IRAS metabolic syndrome analysis.
But ApoB may have an unusual property that sets it apart from that cluster: it doesn't always move with the rest of the group. In some settings the metabolic milieu may be improving even as ApoB rises — as in lean mass hyper-responders, who tend to be leaner with lower TG and higher HDL-C despite having higher ApoB.4
So, if ApoB can rise in a presumably favorable AND unfavorable metabolic environment, then splitting people by a marker of said environment — like fasting insulin — may help us determine whether the same ApoB number has a different association depending on the metabolic milieu it is tracking with — which brings us to Quebec.
Enter the Quebec Cardiovascular Study
The Quebec Cardiovascular Study followed 2,103 men, ages 45 to 76, who were free of IHD at baseline. Over 5 years, 114 individuals had their first event. The analysis used a case-control design: those who developed IHD were matched with a control who likewise stayed event-free, and had similar age, body-mass index, smoking status, and alcohol use.
A couple important points about this paper:
First, diabetics were excluded; therefore, this is a look at hyperinsulinemia in nondiabetic men — the insulin levels aren’t just standing in for overt diabetes.
Second, because it’s a case-control study, the results are presented as odds ratios (ORs). There were no absolute event rates denoted for each subgroup — we will do some fun back calculations to estimate this, but these data were not explicitly reported in the study.
Worth noting, the metabolic metric they used for stratification —fasting insulin — is an imperfect marker of insulin resistance, but it’s a reasonable proxy, similar to TG and HDL-C levels.
For the key analysis, the researchers divided the sample into thirds by fasting insulin and split ApoB at its median (119 mg/dL):
Fasting insulin thirds: <12, 12–15, and >15 μU/mL
ApoB: below vs. at/above 119 mg/dL
The reference group — assigned an OR of 1.0 — was men in the lowest insulin third and below-median ApoB.
For more on ORs, check out the glossary of terms here.
So, what did they find?
Relative to that reference group:
Lowest insulin third + higher ApoB: about 1.8× the odds of IHD
Highest insulin third + lower ApoB: about 3.2× the odds (p=0.04)
Highest insulin third + higher ApoB: about 11× the odds (p<0.001)
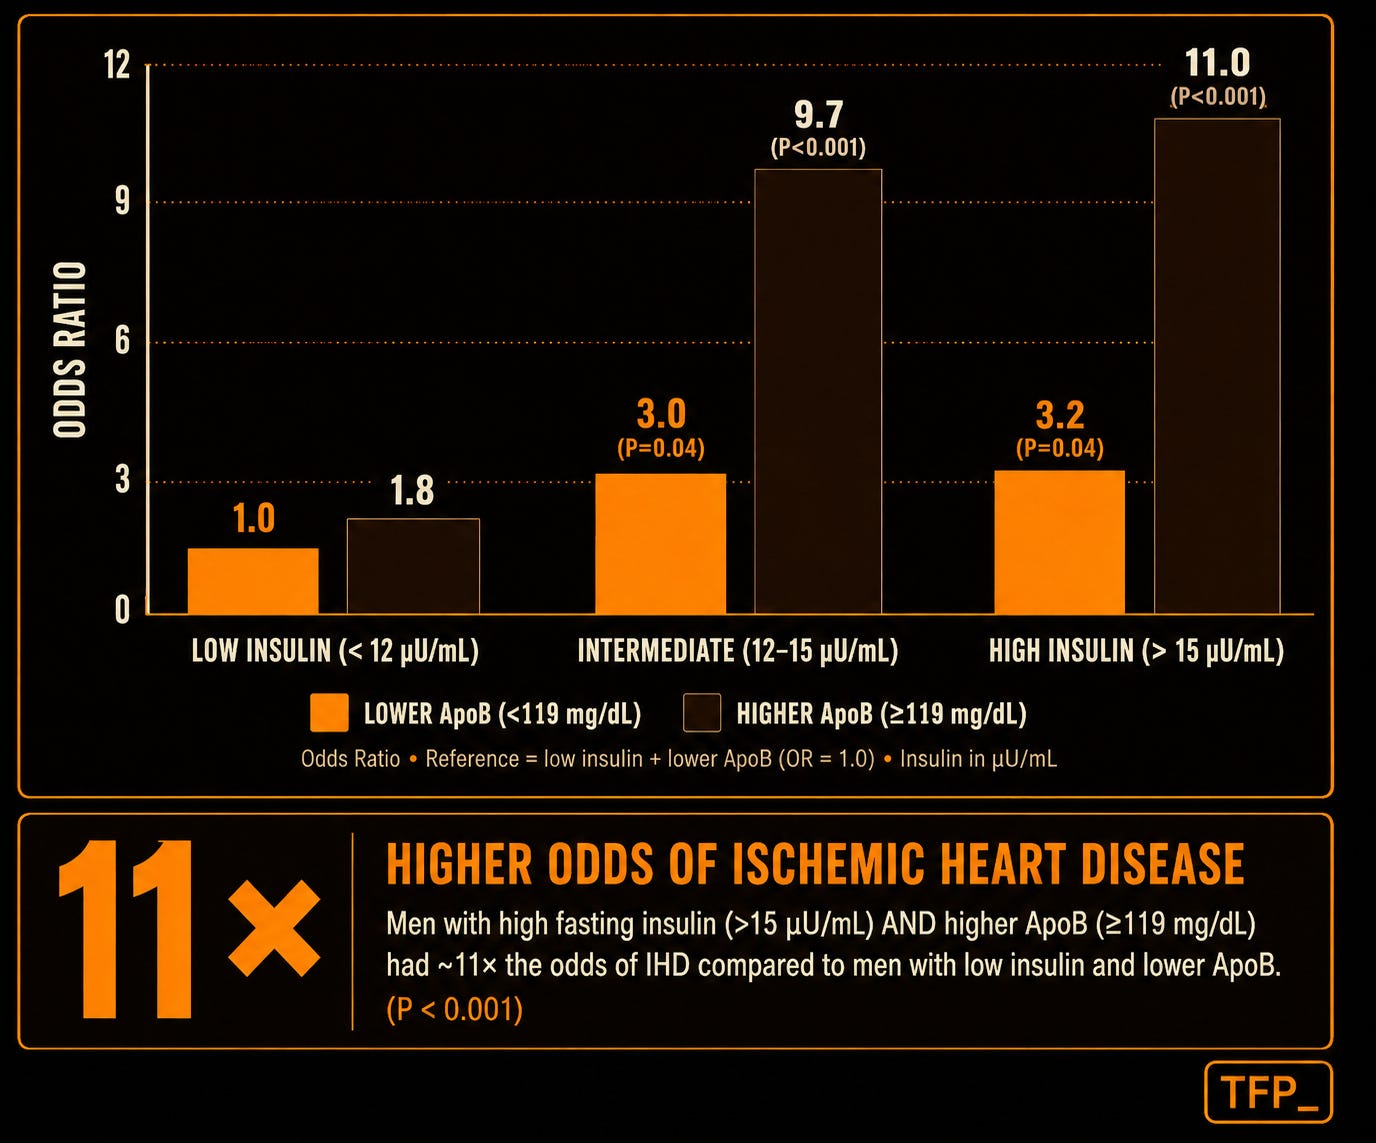
Figure 2: Odds of IHD in the Quebec Cardiovascular Study across combinations of fasting insulin and ApoB, relative to the lowest-insulin/lower-ApoB reference group.
So, what is this saying here?
Higher ApoB in isolation — in the lowest insulin group— was associated with about 1.8× the odds vs. the reference group.
But higher insulin in isolation — in the lower ApoB group— was associated with about 3.2× the odds vs. the reference group.
In other words, the metabolic milieu (delineated as fasting insulin) carried a larger apparent signal than the lipid metric (delineated as ApoB) did based on the cut points provided — though, worth noting, the insulin contrast here is top-third vs. the bottom, while ApoB is split at the median so the comparison isn't perfect.
And when both insulin and ApoB were elevated together, the odds were 11×.
The authors described this as a “synergistic effect”: the strongest association was not higher ApoB on its own, but higher ApoB along with higher fasting insulin (again, the collinearity point).
Now time for some fun calculations 🤓
Relative odds like “1.8×” and “11×” bring up an obvious question: 1.8× what? 11× what? What does this exactly mean?
The study didn’t report absolute event rates for each group — but using some inferences and back calculations, we can actually estimate the absolute event rates to a reasonable degree (see the Appendix for more info).
So, here we go: the full cohort ran about a 5.4% event rate over 5 years. If we look at the six insulin/ApoB groups (assuming ~1/6 in each group) vs. the overall rate and apply the reported ORs, this puts the reference group — lower insulin, lower ApoB — at ~1.1% over 5 years, climbing to ~10 to 12% event rate when both insulin and ApoB were higher.
For our purposes, we would probably want to know the difference between higher and lower ApoB within the lower insulin subgroup — this is the split that distinguishes leaner, more insulin sensitive people between higher and lower LDL-related metrics.
So, moving from lower to higher ApoB corresponds to about 1.8× the odds so in absolute terms, this equates to an estimated event rate changing from ~1% to ~2% over 5 years. Juxtaposed to when insulin was high, that same higher ApoB tracked with a far larger absolute event rate at ~10 to 12%.
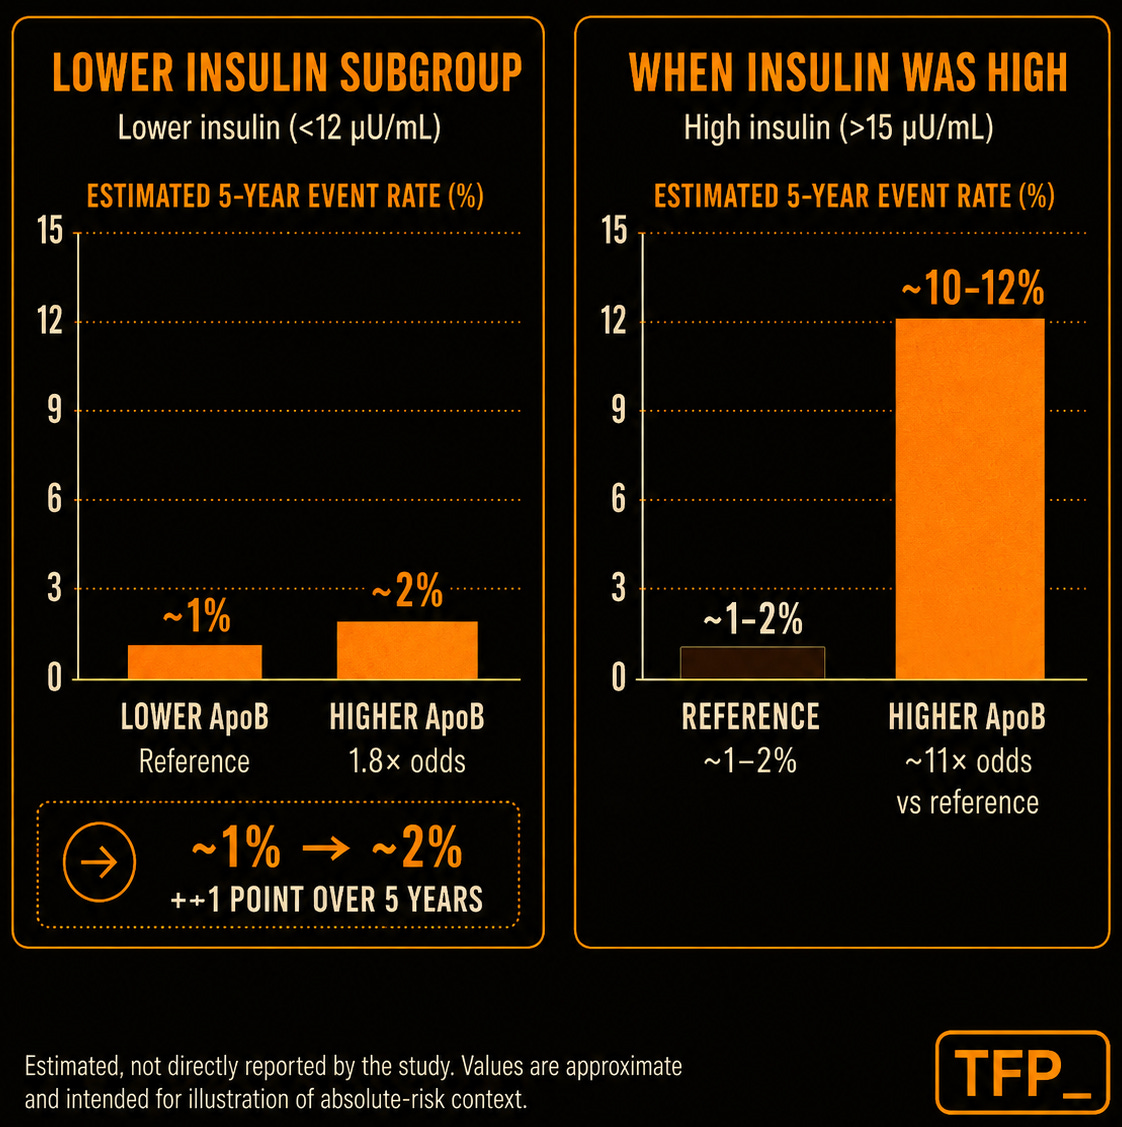
Figure 3: Estimated 5-year absolute IHD event rates inferred from combinations of fasting insulin and ApoB—using back-calculations anchored to the overall cohort event rate.
The estimated weight of higher ApoB looked more modest in a favorable metabolic setting and carried a much higher OR in an unfavorable one — similar to the pattern we saw with LDL-C in Copenhagen.
A few points on insulin and ApoB
In conventional lipidology, ApoB is sometimes described as capturing much of the insulin resistance-mediated association with heart disease — however, Quebec addressed this assertion directly with their modeling. Insulin’s OR was about 1.7 per standard deviation, and it moved to about 1.6 after adjustment for ApoB (as well as LDL-C, TG, and HDL-C).
In plain English: the metabolic environment was predictive of events even when ApoB was accounted for in the modeling. ApoB did not fully encapsulate the insulin resistance-mediated association; insulin carried some association that ApoB didn’t appear to fully capture.
(Of note, ApoB also survived the reverse adjustment too — holding an odds ratio of about 1.9 with insulin in the model. Both appeared to stand on their own, but together, they carried the highest odds of all.)
Likewise, lower insulin was defined as <12 μU/mL — lower than the other groups, but not a widely accepted cut-point for insulin sensitivity.
What would happen if insulin were stratified at say <5 μU/mL? If insulin were very low, might the association between higher ApoB and cardiovascular disease change?
The same question may apply to ApoB as well — the study split it near its median (~119 mg/dL), but a wider contrast, say ApoB >160 vs. <80 mg/dL, might be different.
Some limitations to consider
Quebec draws an interesting picture, but it certainly comes with its caveats (like every study):
The analysis was fairly small. Though the cohort was large overall, the insulin × ApoB comparisons consisted of 91 cases and 105 controls. Smaller number of events may increase the uncertainty around the estimates.
The interaction wasn't statistically significant. The formal test for a multiplicative ApoB and insulin interaction didn't reach statistical significance (p=0.2). This essentially means the modeling didn't establish a true “synergistic” effect between the two metrics. However, to be fair, the analysis may have been underpowered to detect the interaction.
Absolute rates weren’t reported by subgroup. To reinforce, our figures above are estimates.
Men only, and observational. Like Copenhagen, this was men only and almost entirely those of French-Canadian descent — likewise, the study was observational, so it can describe associations, but methodologically, has challenges with establishing explicit causation.
Where this leaves us
Copenhagen used TG/HDL-C and LDL-C stratification. Quebec used fasting insulin and ApoB stratification. Both point to a similar idea around the series: the metabolic milieu around LDL-C or ApoB may determine how strongly they associate with heart disease — even if neither study offers completely definitive answers here. Likewise, insulin appeared to associate with events even when accounting for ApoB and other lipid metrics in the modeling — ApoB did not appear to capture all of the association.
Next week, we will move to the UK and dive into their wonderful biobank of treasures, taking a peek at a large study investigating advanced lipoprotein metrics and their association with heart disease.
As a little teaser, do note, a single ApoB value is derived from LDL particles, VLDL particles, IDL, and remnants — and those don’t always necessarily mean the same thing. They can reflect different metabolic milieus and different lipoprotein trafficking dynamics.
So perhaps the next question isn't only what milieu surrounds the ApoB, but which particles make up that ApoB — and what that tells us about the environment in which the higher ApoB emerges?
We’ll pick it up there in Part 3.
This is Part 2 of our Metabolic Milieu series. As always, we’d encourage you to read the underlying paper, noting the limitations, and resist the urge to oversimplify complex biology.
Appendix: How the absolute event rates were estimated
Overall, there were 114 events among 2,103 men, or 5.42% over 5 years.
Figure 1 reports 6 ORs for the ApoB/insulin groups: 1.0, 1.8, 3.0, 9.7, 3.2, and 11.0.
We treated the ORs as rough risk ratios, which may be reasonable here given the relatively low overall event rate.
Insulin was divided into tertiles and ApoB at the median, so each of the 6 cells should contain ~1/6 of the cohort if the 2 variables are not strongly associated. Their reported correlation was fairly weak (r 0.16), so we think this is a reasonable approximation.
The 6 ORs sum to 29.7, giving an ave OR of 4.95.
Since the overall 5-year event rate was 5.42%, the implied event rate in the reference group is:
5.42% ÷ 4.95 ≈ 1.1%
We then multiplied that ~1.1% reference rate by each reported OR to estimate the absolute event rate for each group.
These are the full reconstructed estimates below:
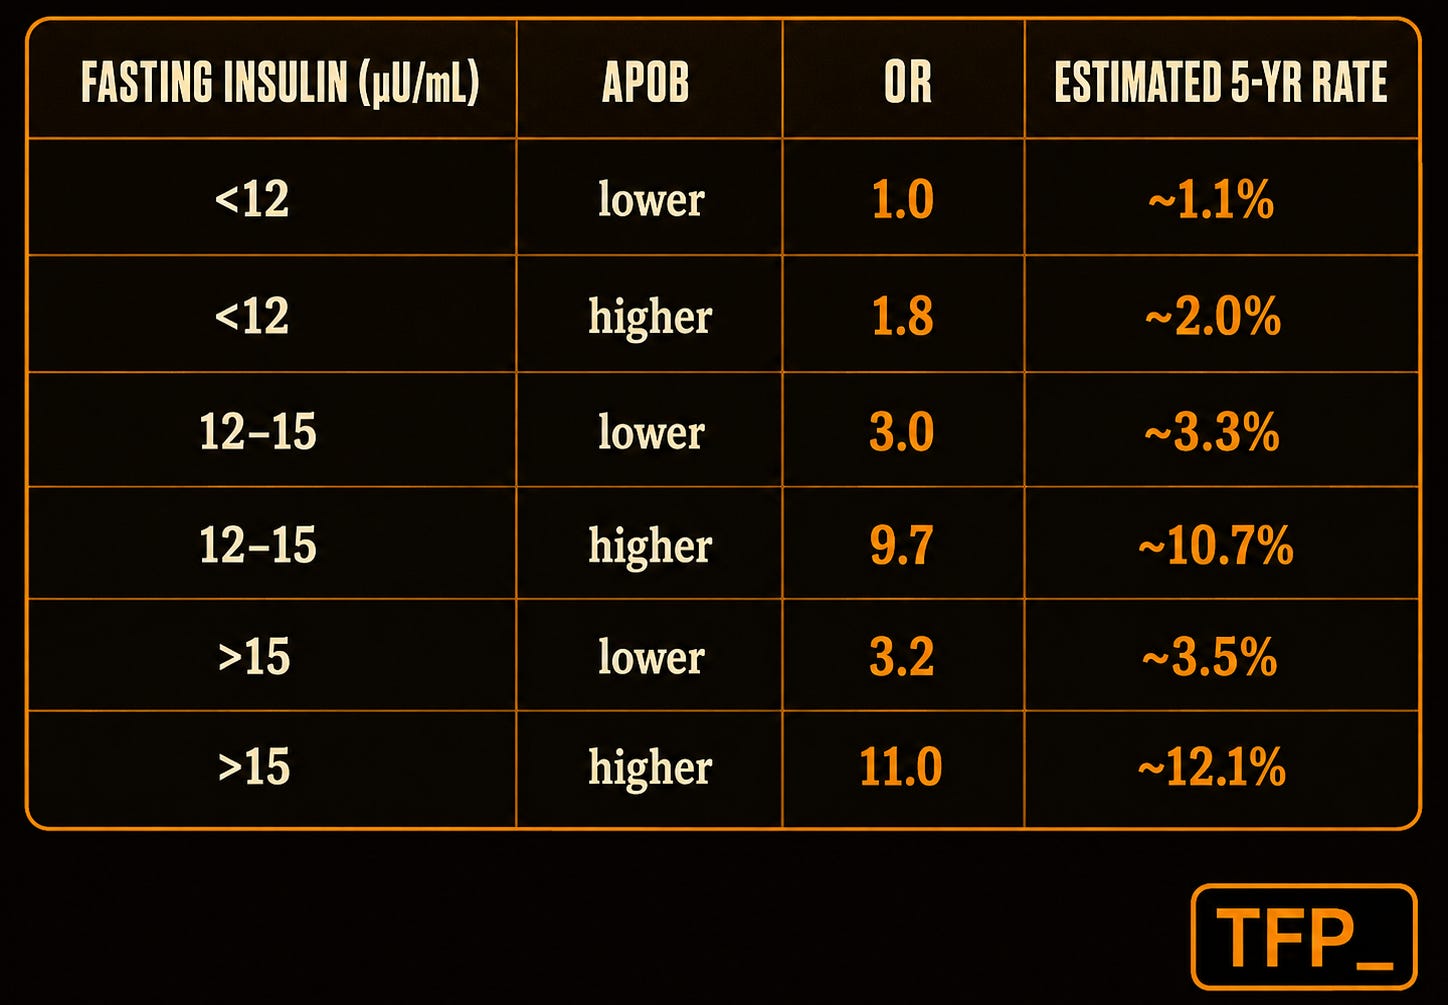
Some checks on the estimate:
Internal consistency: The 6 estimated event rates ave to about 5.45%, which is very close to the 5.42% event rate reported for the full cohort.
External consistency: We also compared the estimates with WOSCOPS (citation from Copenhagen in Part 1), which reported ~5.3% 5-year event rate in men with isolated hypercholesterolemia and ~14.1% in those with metabolic syndrome. Our estimates are in the same general range. The higher insulin/ApoB group is at ~10–12%, the lower insulin groups are closer to ~1–3.5%.
Ranges: OR as a risk ratio becomes less accurate as event rates go up, so we also estimated using the standard OR to RR conversion equation: RR = OR / [(1 − reference risk) + (reference risk × OR)]. Using the ~1.1% reference rate lowers the estimate from ~12.1% to ~10.9%. — we think ~10–12% is a fairer estimate than giving a single number.
I’m a 53 year old male on carnivore. I’m 5’8” and 160 lbs. hsCRP low, triglycerides 81, HDL 50 and fasting insulin (9.6 μU/mL) but all my other cholesterol numbers are considered high. How does this ApoB data also mix with high lp(a)?
Just had a CAC with a score of zero but my doctors say that means nothing and want me on high dose statins.
APOLIPOPROTEINS & INFLAMMATION
Apolipoprotein B (ApoB): 233 mg/dL (ref <90) — H
Lipoprotein(a), Lp(a): 402 nmol/L (ref <75 optimal; >125 = high) — H
hs-C-Reactive Protein (hs-CRP): 0.6 mg/L (optimal <1.0)
LIPOPROTEIN FRACTIONATION — ION MOBILITY
LDL Particle Number: 2686 nmol/L (ref <1138) — H
LDL Small: 579 nmol/L (ref <142) — H
LDL Medium: 780 nmol/L (ref <215) — H
HDL Large: 5130 nmol/L (ref >6729) — L
LDL Peak Size: 217.2 Å (ref >222.9) — L
LDL Pattern: B (Pattern A large/buoyant is optimal)
This is a clearer signal that metabolic context proxied by fasting insulin can materially change the observed association of ApoB with events. It aligns with the broader Feldman framing that particle number is necessary, but the surrounding metabolic environment influences the actual risk. The study does not prove risk level, but it is consistent with the hypothesis that context meaningfully modulates the relationship. Ongoing imaging and longer-term data in LMHR-like cohorts remain the more decisive tests. This continues to be a fascinating exploration.